Fig. 6
Download original image
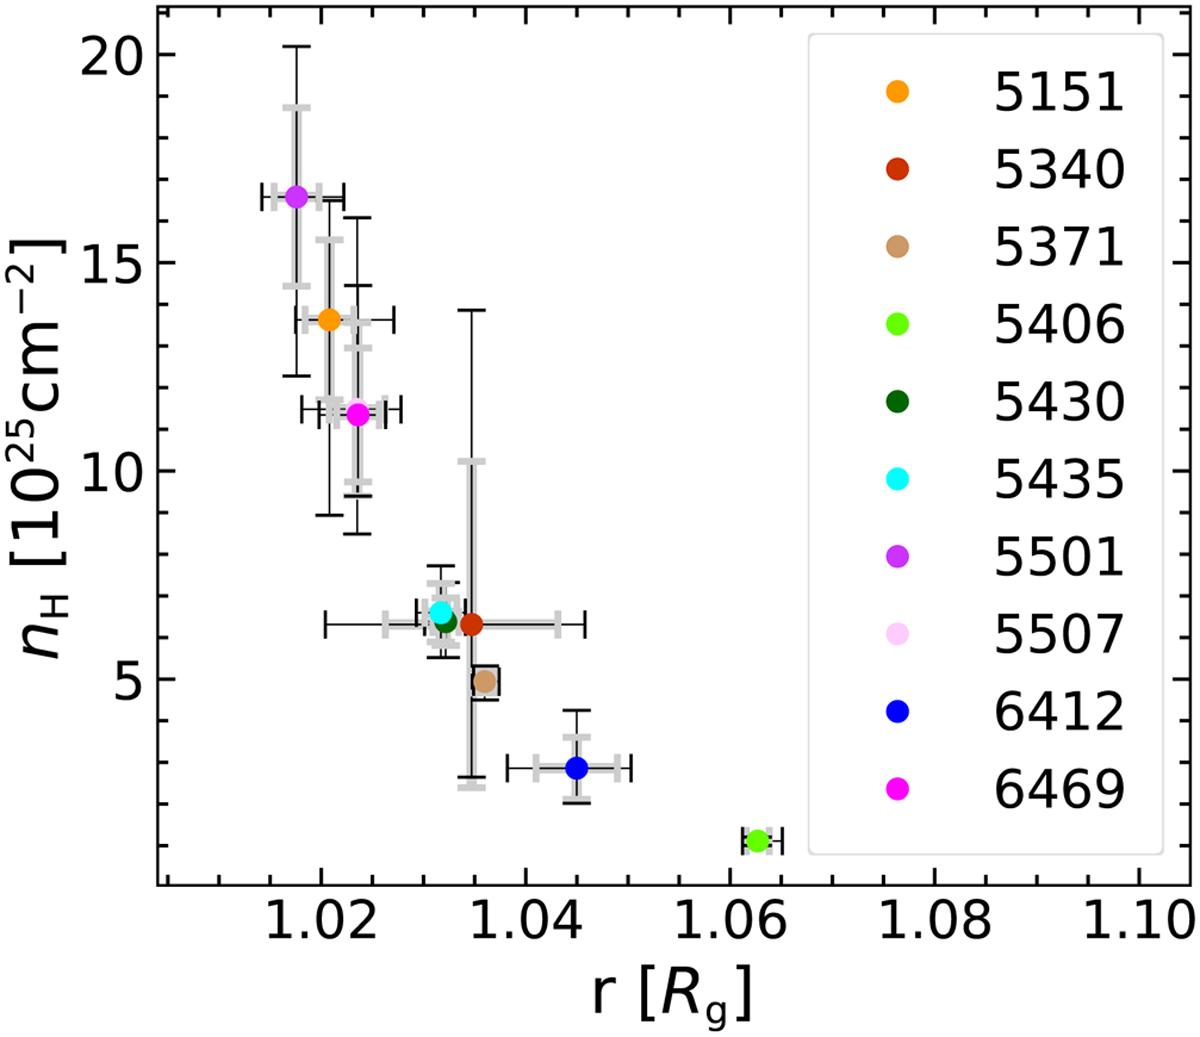
Column density as a function of the average minimal distance r from the RG centre over our set of orbital phases and models with and without macroturbulence for individual Fe I absorption lines (dots), based on the values in Table 2. The grey error bars show the standard deviation, and the black error bars represent the total range of determined r from the models.
Current usage metrics show cumulative count of Article Views (full-text article views including HTML views, PDF and ePub downloads, according to the available data) and Abstracts Views on Vision4Press platform.
Data correspond to usage on the plateform after 2015. The current usage metrics is available 48-96 hours after online publication and is updated daily on week days.
Initial download of the metrics may take a while.