Fig. 1
Download original image
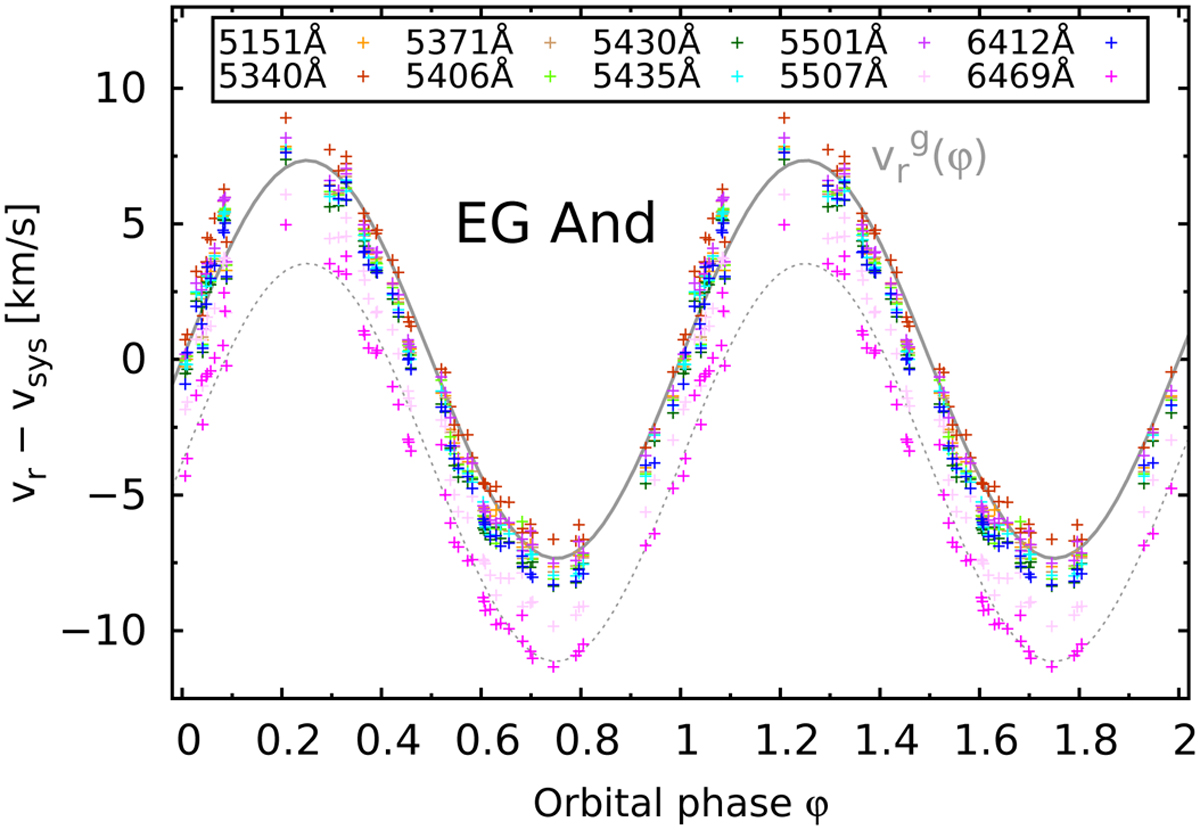
Orbital variability in RVs of individual Fe I absorption lines (the corresponding colours are given in the legend). The solid grey line represents the RV curve of the RG, ![]() , of Kenyon & Garcia (2016). Negative shifts of Fe I RV curves with respect to the
, of Kenyon & Garcia (2016). Negative shifts of Fe I RV curves with respect to the ![]() curve indicate an outflow of matter from the donor star. The Fe I 6469 Å line shows the highest outflow velocities, with an average value of −3.8 km s−1 (dotted line). At ϕ ≈ 0−0.2, low inflow velocities are indicated for a fraction of Fe I lines. The data points are duplicated at orbital phases 1.0−2.0 for a more continuous view of the variability.
curve indicate an outflow of matter from the donor star. The Fe I 6469 Å line shows the highest outflow velocities, with an average value of −3.8 km s−1 (dotted line). At ϕ ≈ 0−0.2, low inflow velocities are indicated for a fraction of Fe I lines. The data points are duplicated at orbital phases 1.0−2.0 for a more continuous view of the variability.
Current usage metrics show cumulative count of Article Views (full-text article views including HTML views, PDF and ePub downloads, according to the available data) and Abstracts Views on Vision4Press platform.
Data correspond to usage on the plateform after 2015. The current usage metrics is available 48-96 hours after online publication and is updated daily on week days.
Initial download of the metrics may take a while.