Fig. 9.
Download original image
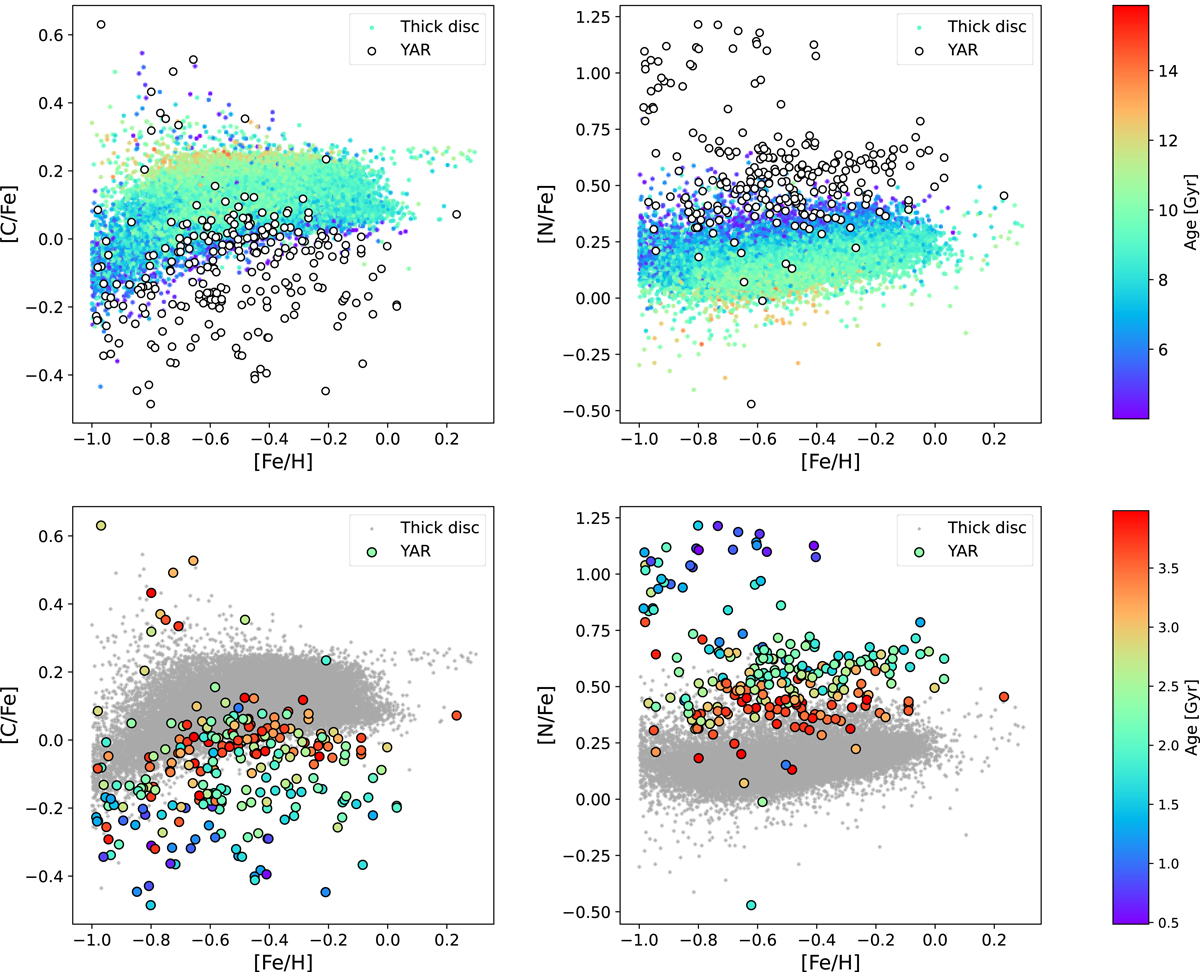
Carbon and nitrogen distributions as a function of metallicity for thick disc and YAR stars. Top plots: thick disc stars are colour-coded according to their age while YAR stars are shown as black empty circles. Bottom plots: YAR stars are colour-coded according to their ages, while the thick disc sample is shown as grey points.
Current usage metrics show cumulative count of Article Views (full-text article views including HTML views, PDF and ePub downloads, according to the available data) and Abstracts Views on Vision4Press platform.
Data correspond to usage on the plateform after 2015. The current usage metrics is available 48-96 hours after online publication and is updated daily on week days.
Initial download of the metrics may take a while.