Fig. 6.
Download original image
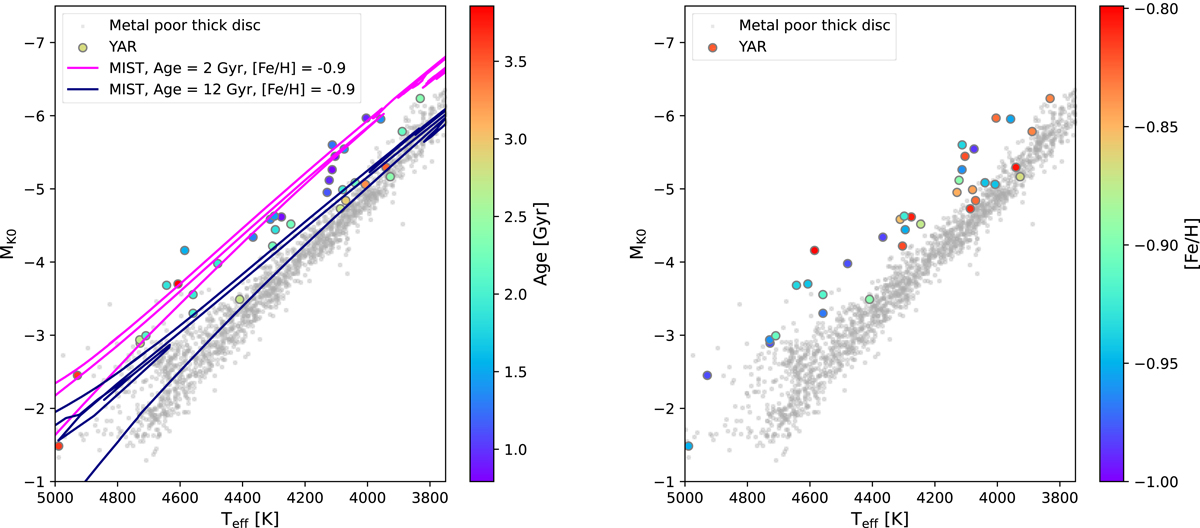
HRD of the YAR stars with log g < 2.2 and −1 < [Fe/H]< − 0.8 dex. The colour of the points is coding age (left plot) and metallicity (right plot). MIST isochrones at 2 and 12 Gyr are also plotted on the left plot in fuchsia and dark blue, respectively. In both panels, the small grey dots in background represent the thick disc reference sample (details of the selection are given in Sect. 2.2) restricted to [Fe/H]< − 0.8.
Current usage metrics show cumulative count of Article Views (full-text article views including HTML views, PDF and ePub downloads, according to the available data) and Abstracts Views on Vision4Press platform.
Data correspond to usage on the plateform after 2015. The current usage metrics is available 48-96 hours after online publication and is updated daily on week days.
Initial download of the metrics may take a while.