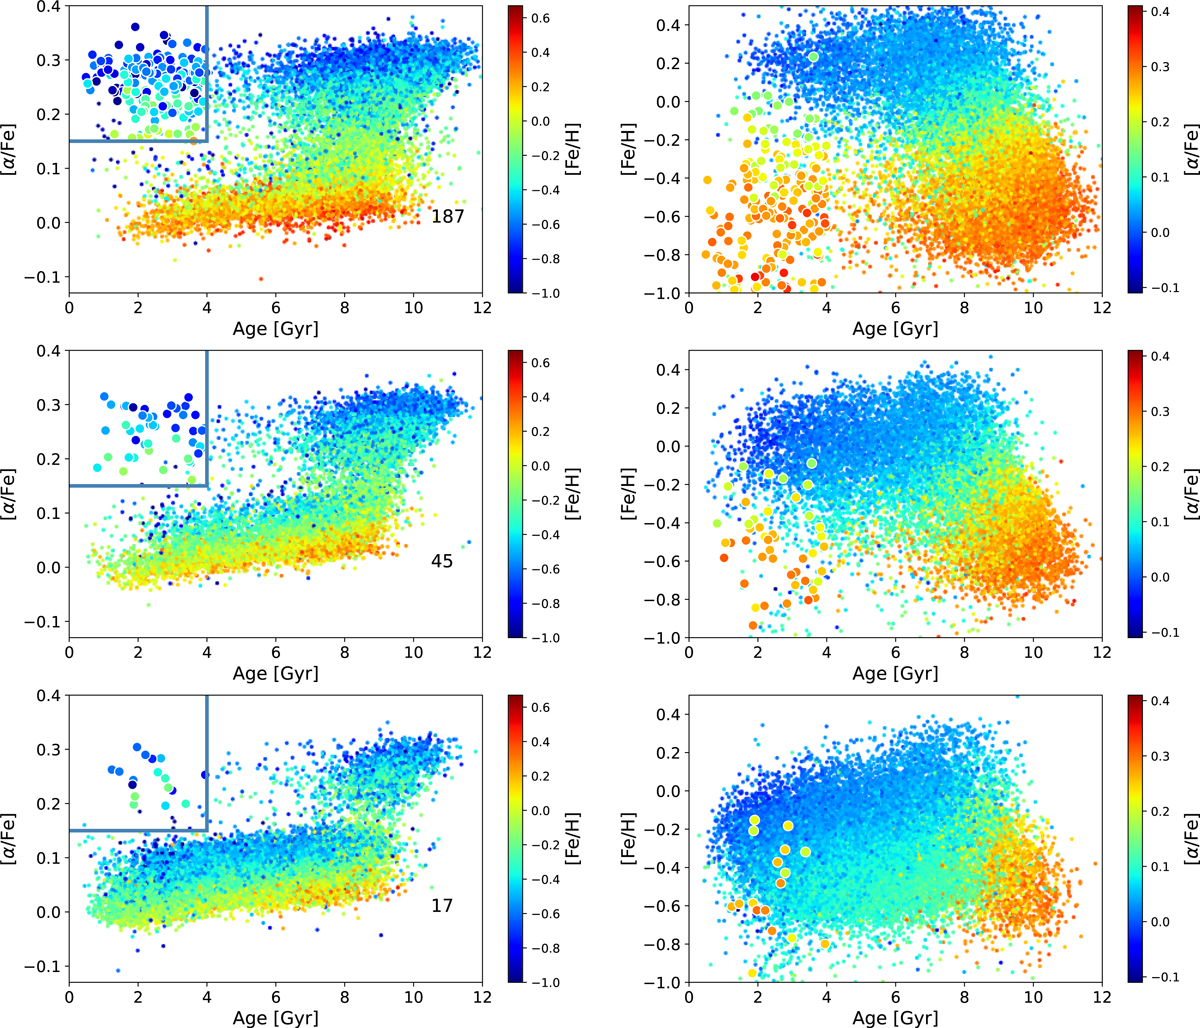
Fig. 4.
Download original image
Sample used in this study divided in three separate intervals of mean radius: 0–6 kpc (top panels), 6–9 kpc (middle panels), and 9–20 kpc (bottom panels). The number of stars above the line at [α/Fe] = 0.15 and younger than 4 Gyr is indicated on each plot. All the stars in this figure were selected to have an error on age below 3 Gyr.
Current usage metrics show cumulative count of Article Views (full-text article views including HTML views, PDF and ePub downloads, according to the available data) and Abstracts Views on Vision4Press platform.
Data correspond to usage on the plateform after 2015. The current usage metrics is available 48-96 hours after online publication and is updated daily on week days.
Initial download of the metrics may take a while.