Fig. 13.
Download original image
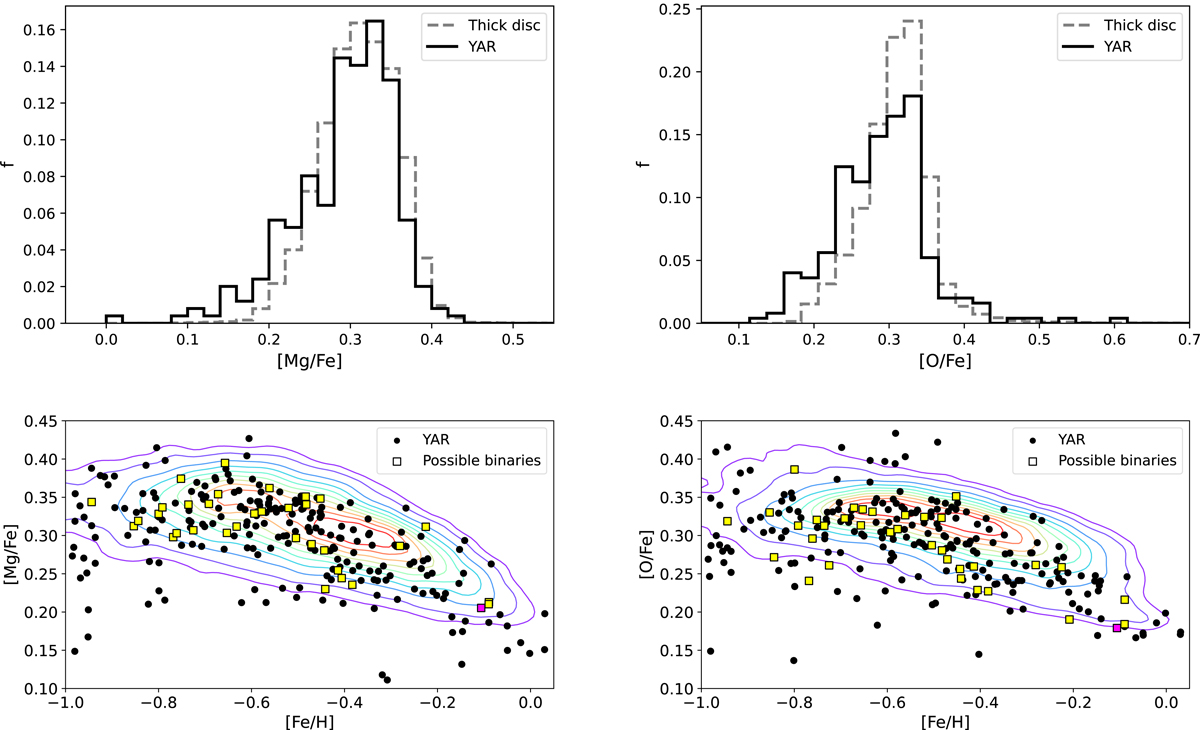
Comparison of magnesium and oxygen abundance for stars in the YAR sample and stars in the thick disc. Top panels: Thick disc sample is represented by the grey dashed histogram, while the distribution of YAR stars is represented by the black solid histogram. Bottom panels: Thick disc reference sample is highlighted with iso-density contours at 90%, 80%, 70%, 60%, 50%, 40%, 30%, 20%, 10%, and 5% of the peak density, while the YAR sample is represented by black dots. The potential YAR binaries are denoted by squares: yellow squares indicate stars that exhibit at least one indicator of being a binary, while the magenta square represents the single star that fulfils all the examined indicators (see Sect. 2.2).
Current usage metrics show cumulative count of Article Views (full-text article views including HTML views, PDF and ePub downloads, according to the available data) and Abstracts Views on Vision4Press platform.
Data correspond to usage on the plateform after 2015. The current usage metrics is available 48-96 hours after online publication and is updated daily on week days.
Initial download of the metrics may take a while.