Fig. 10.
Download original image
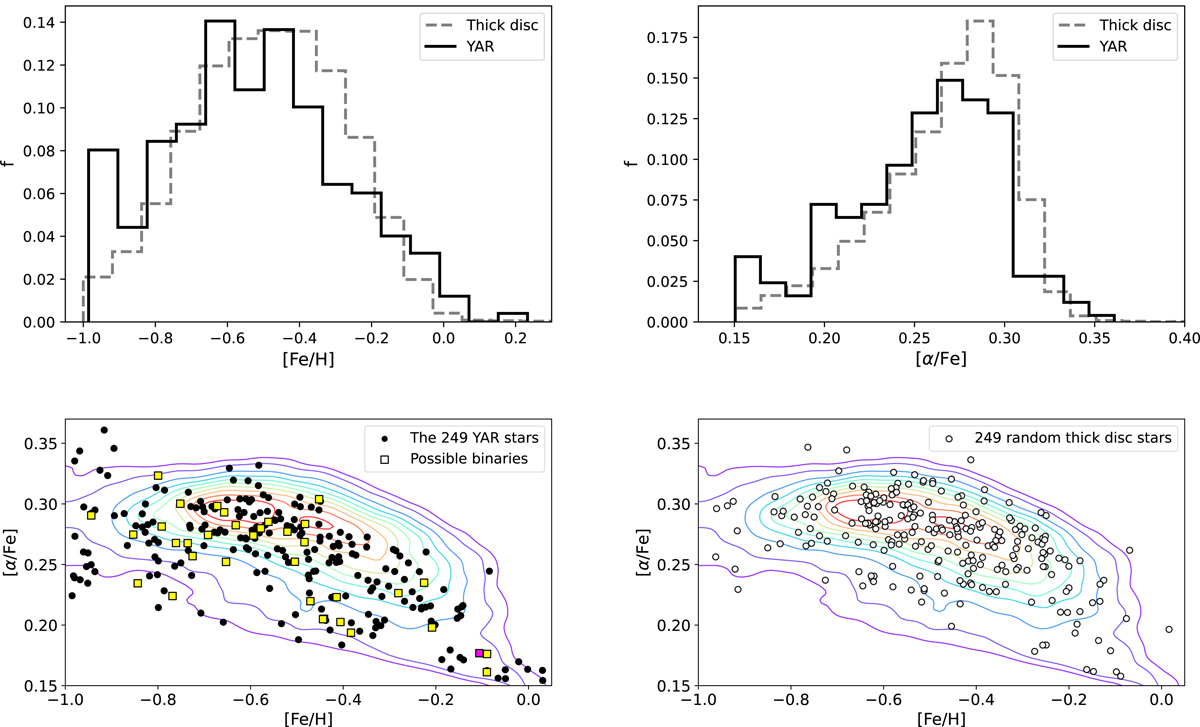
Chemical characterisation of the thick disc and YAR sample for red giant-type stars. Top panels: MDFs and [α/Fe] distribution functions of the YAR (in solid black lines) and thick disc (in dashed grey lines) samples. f = Ni/Ntot represents the fractional number density where Ni is the number of stars in each bin of [Fe/H] or [α/Fe] and Ntot is the total number of stars of the sample. Bottom panels: [α/Fe]−[Fe/H] distribution for YAR stars (black dots, left panel) and a randomly selected thick disc subsample (empty dots, right panel), both containing the same number of stars (written the relative legends.) The potential YAR binaries are denoted by squares: yellow squares indicate stars that exhibit at least one indicator of being a binary, while the magenta square represents the single star that fulfils all the examined indicators (see Sect. 2.2). In both plots, the coloured lines represent stellar density iso-contours of the entire thick disc sample: 90%, 80%, 70%, 60%, 50%, 40%, 30%, 20%, 10%, and 5% of the peak density.
Current usage metrics show cumulative count of Article Views (full-text article views including HTML views, PDF and ePub downloads, according to the available data) and Abstracts Views on Vision4Press platform.
Data correspond to usage on the plateform after 2015. The current usage metrics is available 48-96 hours after online publication and is updated daily on week days.
Initial download of the metrics may take a while.