Fig. 1.
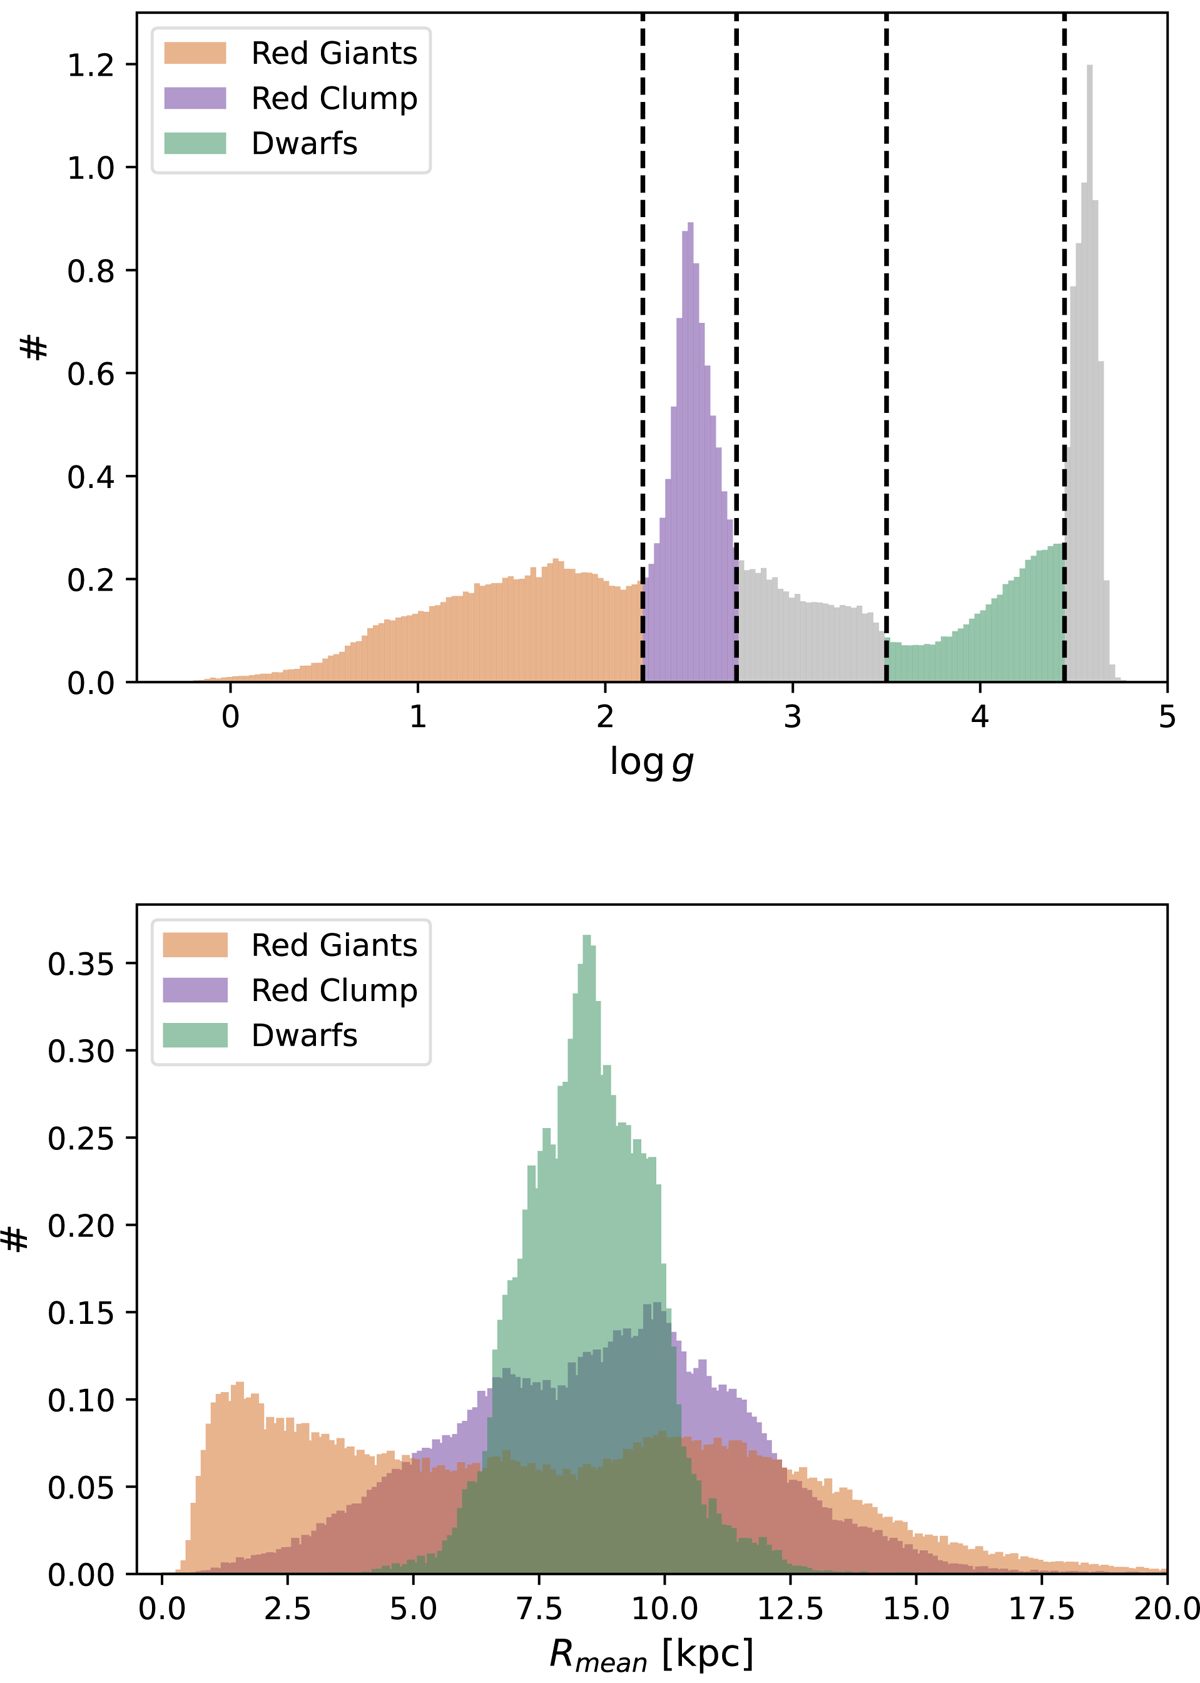
Download original image
Distributions of surface gravity and mean radius of APOGEE DR17 flag selected stars. The log g normalised histogram is shown at the top. The dashed vertical lines represent the thresholds chosen to select stars in three log g intervals (red giants: log g < 2.2, in orange; red clump stars: 2.2 < log g < 2.7, in purple; dwarfs: 3.5 < log g < 4.45, in green). The mean orbital radii density histogram of the selected stars separated into the three log g intervals is shown at the bottom, with the same legend as in the top panel.
Current usage metrics show cumulative count of Article Views (full-text article views including HTML views, PDF and ePub downloads, according to the available data) and Abstracts Views on Vision4Press platform.
Data correspond to usage on the plateform after 2015. The current usage metrics is available 48-96 hours after online publication and is updated daily on week days.
Initial download of the metrics may take a while.