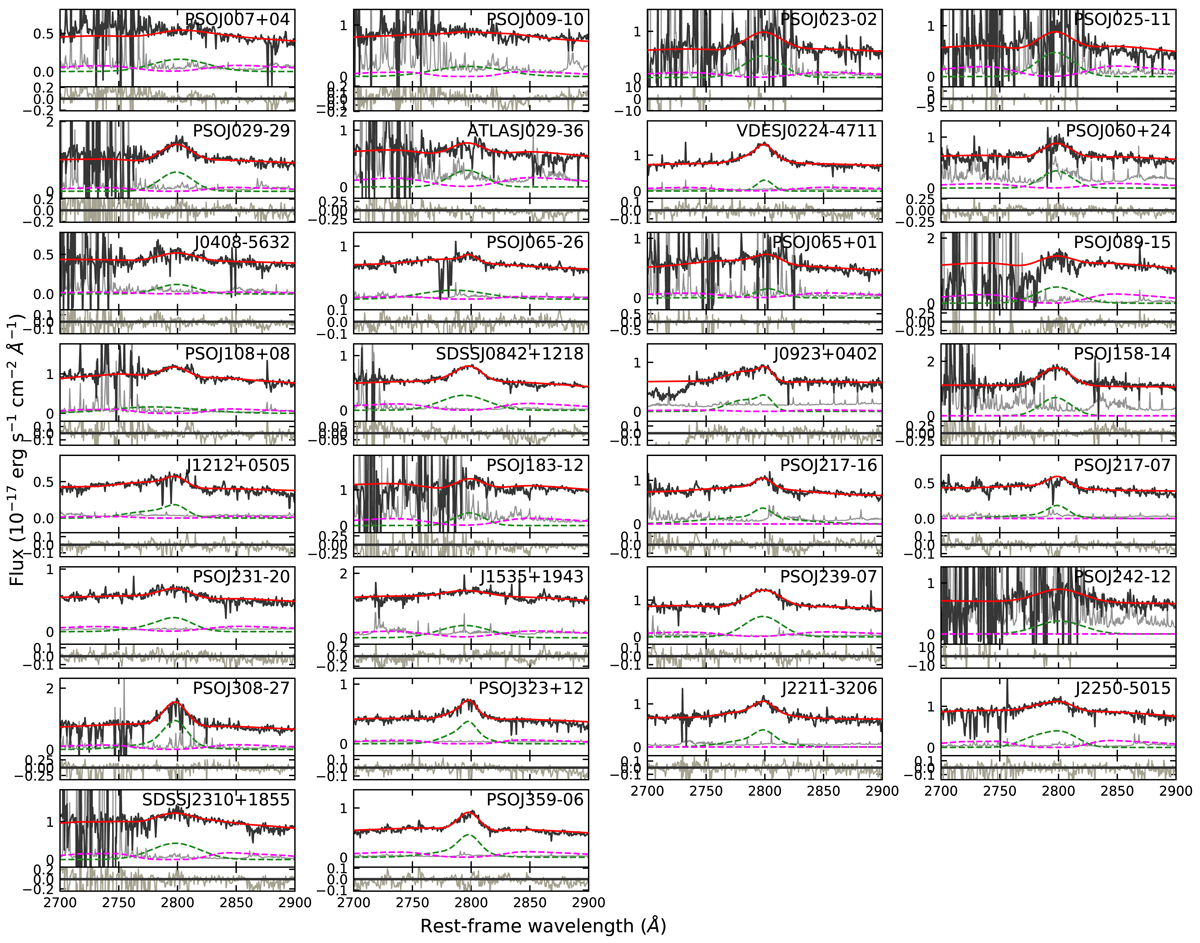
Fig. 1.

Download original image
Spectral region centered on the Mg II emission line for the XQR-30 sample. The pseudo-continuum (power law + Balmer contribution + Fe II empirical template) and multiple Gaussian lines fit are shown with dashed magenta and green lines, respectively, while the total fit is shown in red. We also show the residuals (in grey) in the lower panels. We note that in few cases the Mg II emission line falls partially (PSOJ007+04, PSOJ009−10, PSOJ183−12, PSOJ065+01) or fully (PSOJ023−02, PSOJ025−11, PSOJ242−12) in a region affected by telluric absorption. Despite the general high S/N of our spectra, given the (much) higher noise in these regions, the fit of these objects could be affected.
Current usage metrics show cumulative count of Article Views (full-text article views including HTML views, PDF and ePub downloads, according to the available data) and Abstracts Views on Vision4Press platform.
Data correspond to usage on the plateform after 2015. The current usage metrics is available 48-96 hours after online publication and is updated daily on week days.
Initial download of the metrics may take a while.


