Fig. 9.
Download original image
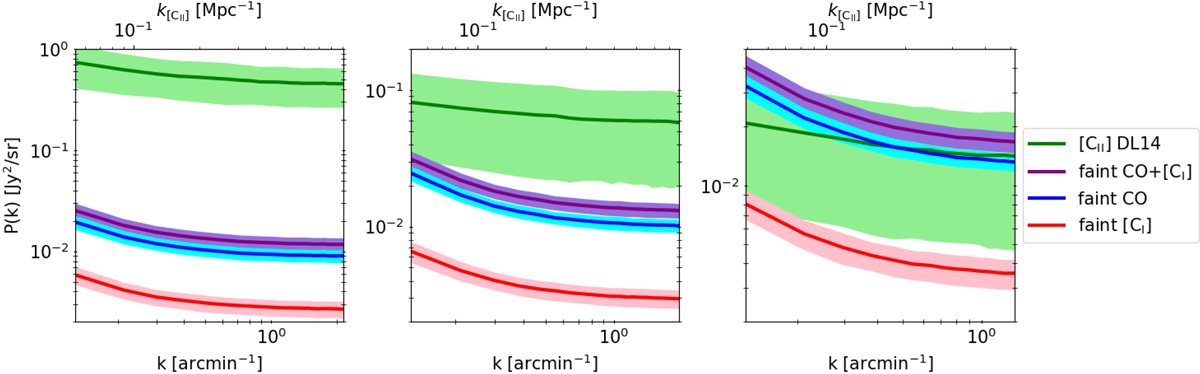
Mean APS (solid lines) and the 1σ FtF variance interval (coloured area) for a 2 deg2 field, for [CII], faint CO, faint [CI], and the sum of the last two (green, blue, red, and purple, respectively). This is shown, from left to right, for 300–305 GHz centred on z[CII] = 5.2, for 260–265 GHz centred on z[CII] = 6.5, and for 235–240 GHz centred on z[CII] = 7.
Current usage metrics show cumulative count of Article Views (full-text article views including HTML views, PDF and ePub downloads, according to the available data) and Abstracts Views on Vision4Press platform.
Data correspond to usage on the plateform after 2015. The current usage metrics is available 48-96 hours after online publication and is updated daily on week days.
Initial download of the metrics may take a while.