Fig. 8.
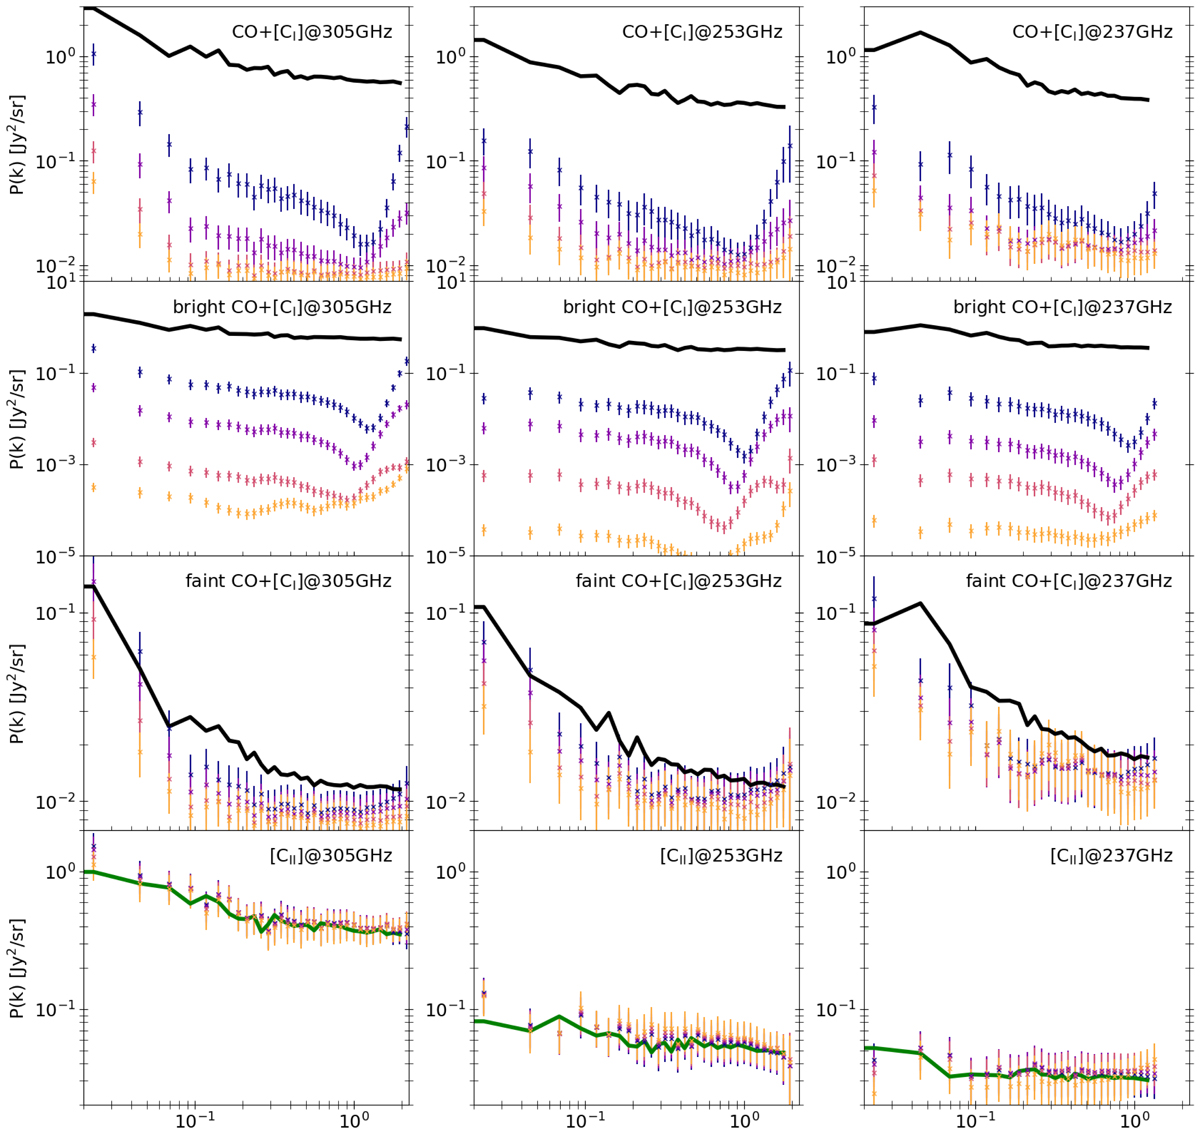
Download original image
APS (in Jy2 sr−1) as a function of spatial frequency k (in arcmin−1) for the three observed frequencies (from left to right): 305, 253, and 237 GHz. This is shown (from top to bottom) for each component separately: all the interlopers (CO+[CI]), the bright interlopers (i.e. above the mass threshold), the faint interlopers, and [CII]. The intrinsic power spectra of each (unmasked) component are shown with solid black lines, and with a solid green line for [CII]. The power spectra obtained from the maps that are masked using rσ = 1.5–3.0 are shown with coloured points (from blue to yellow, respectively).
Current usage metrics show cumulative count of Article Views (full-text article views including HTML views, PDF and ePub downloads, according to the available data) and Abstracts Views on Vision4Press platform.
Data correspond to usage on the plateform after 2015. The current usage metrics is available 48-96 hours after online publication and is updated daily on week days.
Initial download of the metrics may take a while.