Fig. 7.
Download original image
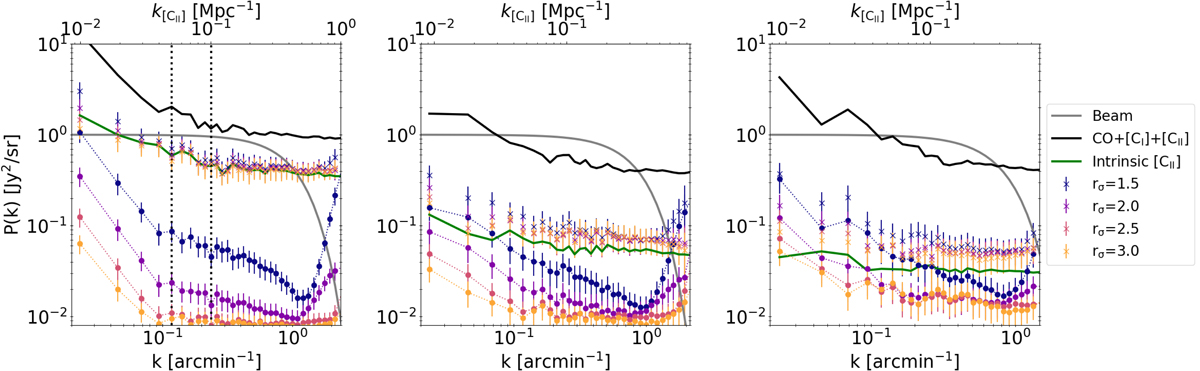
APS as a function of spatial frequency, k. The solid black line shows the APS of the interloper-contaminated map (i.e. CO+[CI] + [CII]) with no mask. The solid green line shows the intrinsic [CII] APS (from the unmasked contamination-free [CII] map). Coloured crosses show the [CII] APS estimates, obtained from masking the interloper-contaminated map with the different masks from rσ = 1.5 to 3.0. Coloured points linked by dotted lines show the residual interlopers’ APS measured on the masked interloper map (i.e. CO+[CI] after masking) at (from left to right) z = 5.2, 6.5, and 7. The beam APS at the corresponding observed frequency is shown in grey. Vertical lines highlight the range k = 0.12–0.24 arcmin−1.
Current usage metrics show cumulative count of Article Views (full-text article views including HTML views, PDF and ePub downloads, according to the available data) and Abstracts Views on Vision4Press platform.
Data correspond to usage on the plateform after 2015. The current usage metrics is available 48-96 hours after online publication and is updated daily on week days.
Initial download of the metrics may take a while.