Fig. 4.
Download original image
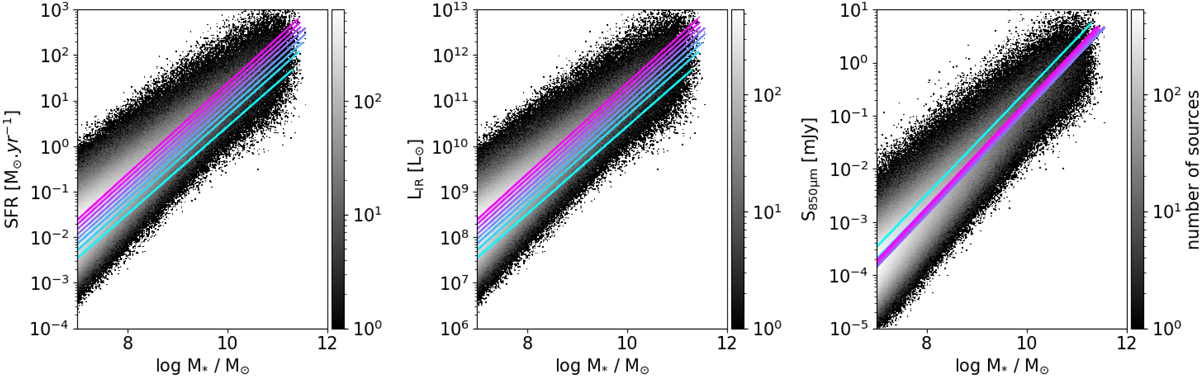
Stellar mass distribution of sources as a function of different CO proxies available in SIDES. The stellar mass distribution of SIDES sources is shown in grey scale as a function of different proxies up to z < 3.5 (from left to right): M* − SFR, M* − LIR, and M* − S850. The best fits for each relation in each redshift bin (given in Table 1) are over plotted, from pink for the first bin (0 < z < 0.35) to cyan for the last bin (2.75 < z < 3.5).
Current usage metrics show cumulative count of Article Views (full-text article views including HTML views, PDF and ePub downloads, according to the available data) and Abstracts Views on Vision4Press platform.
Data correspond to usage on the plateform after 2015. The current usage metrics is available 48-96 hours after online publication and is updated daily on week days.
Initial download of the metrics may take a while.