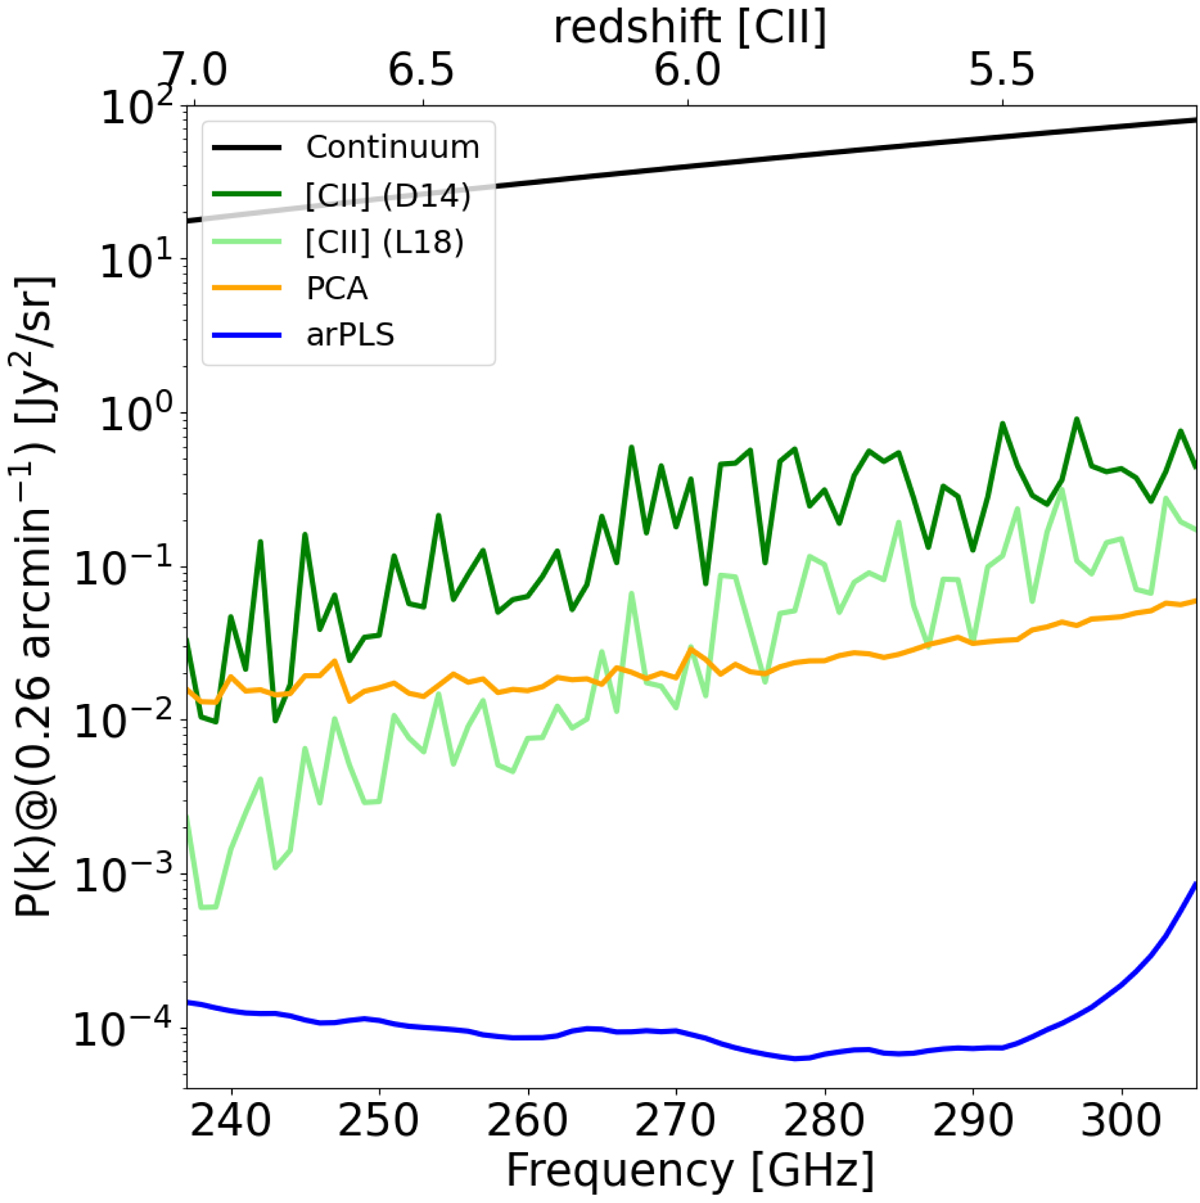
Fig. 2.
Download original image
APS amplitude as a function of frequency for the continuum (solid black line), the [CII] generated with the DL14 or L18 SFR-L[CII] relations (green and light green lines, respectively), the residual continuum obtained with PCA (Sect. 3.1) using the first two principal components (orange line), and the residual continuum obtained with arPLS (Sect. 3.2, blue line). The power spectrum amplitude is averaged at k = 0.26 arcmin−1 in frequency channels of 1 GHz width.
Current usage metrics show cumulative count of Article Views (full-text article views including HTML views, PDF and ePub downloads, according to the available data) and Abstracts Views on Vision4Press platform.
Data correspond to usage on the plateform after 2015. The current usage metrics is available 48-96 hours after online publication and is updated daily on week days.
Initial download of the metrics may take a while.