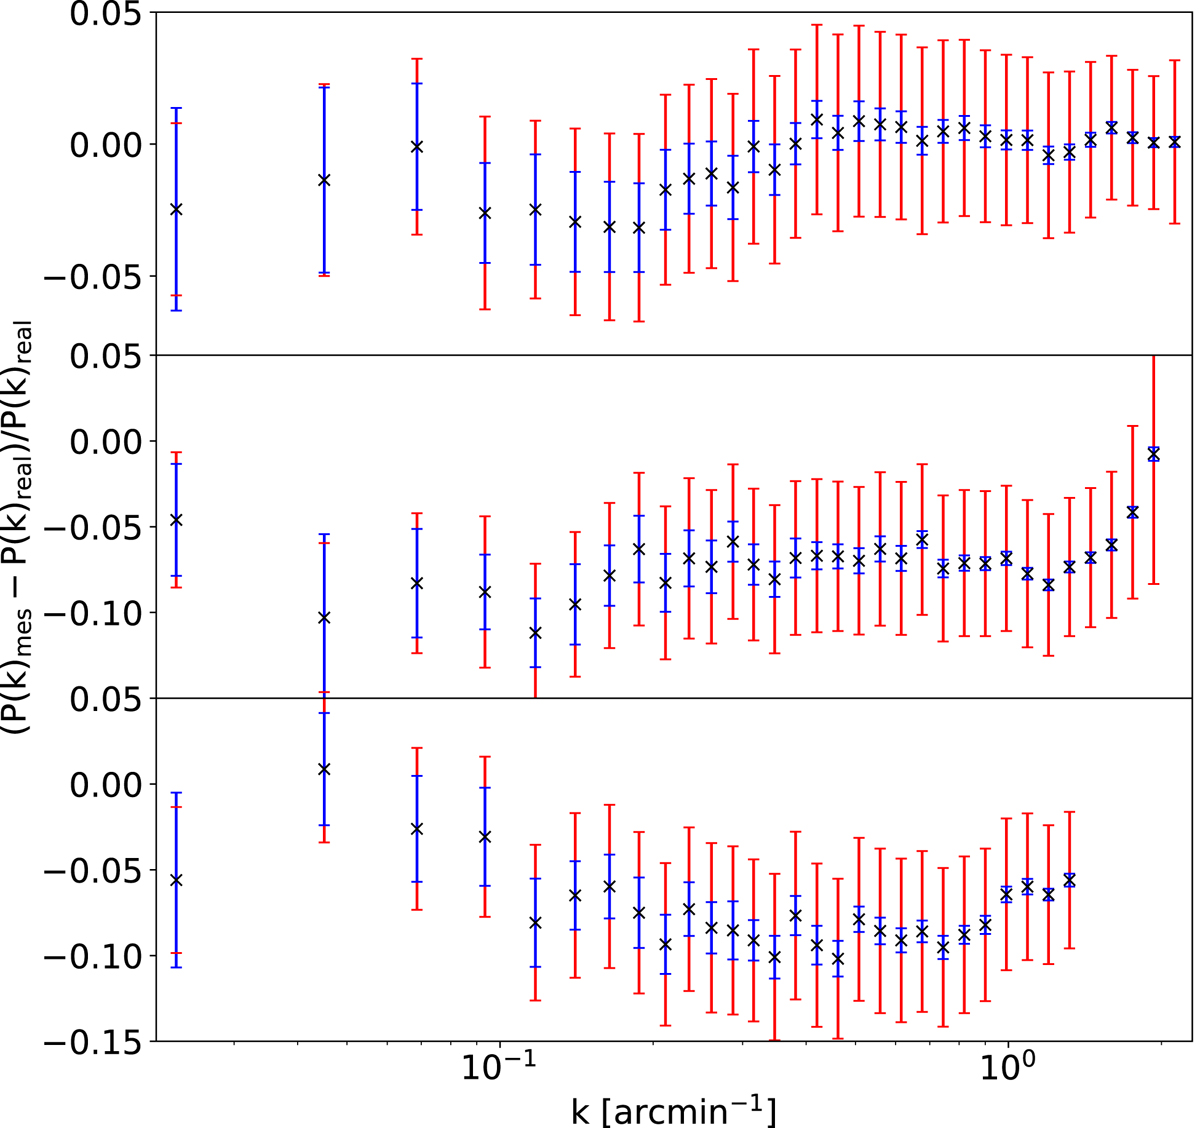
Fig. A.2.
Download original image
Average relative error (black crosses) between the [CII] APS measured in the 54 Uchuu sub-fields masked with rσ = 3 as a function of spatial frequency, k, at z = 5.2 (top), z = 6.5 (middle), and z = 7 (bottom). The mean errors over the k modes are < 1%, 7%, and 8% for each redshift, respectively. The dispersion (red error bars) normalized by the square root of the number of realizations is also represented. The mean sizes of these normalized error bars over the k modes are 3%, 4%, and 5% for each redshift, respectively. For reference, the equivalent normalized error bars for a perfect Gaussian diffuse signal from the same number of Monte Carlo realizations are over-plotted in blue.
Current usage metrics show cumulative count of Article Views (full-text article views including HTML views, PDF and ePub downloads, according to the available data) and Abstracts Views on Vision4Press platform.
Data correspond to usage on the plateform after 2015. The current usage metrics is available 48-96 hours after online publication and is updated daily on week days.
Initial download of the metrics may take a while.