Fig. A.1.
Download original image
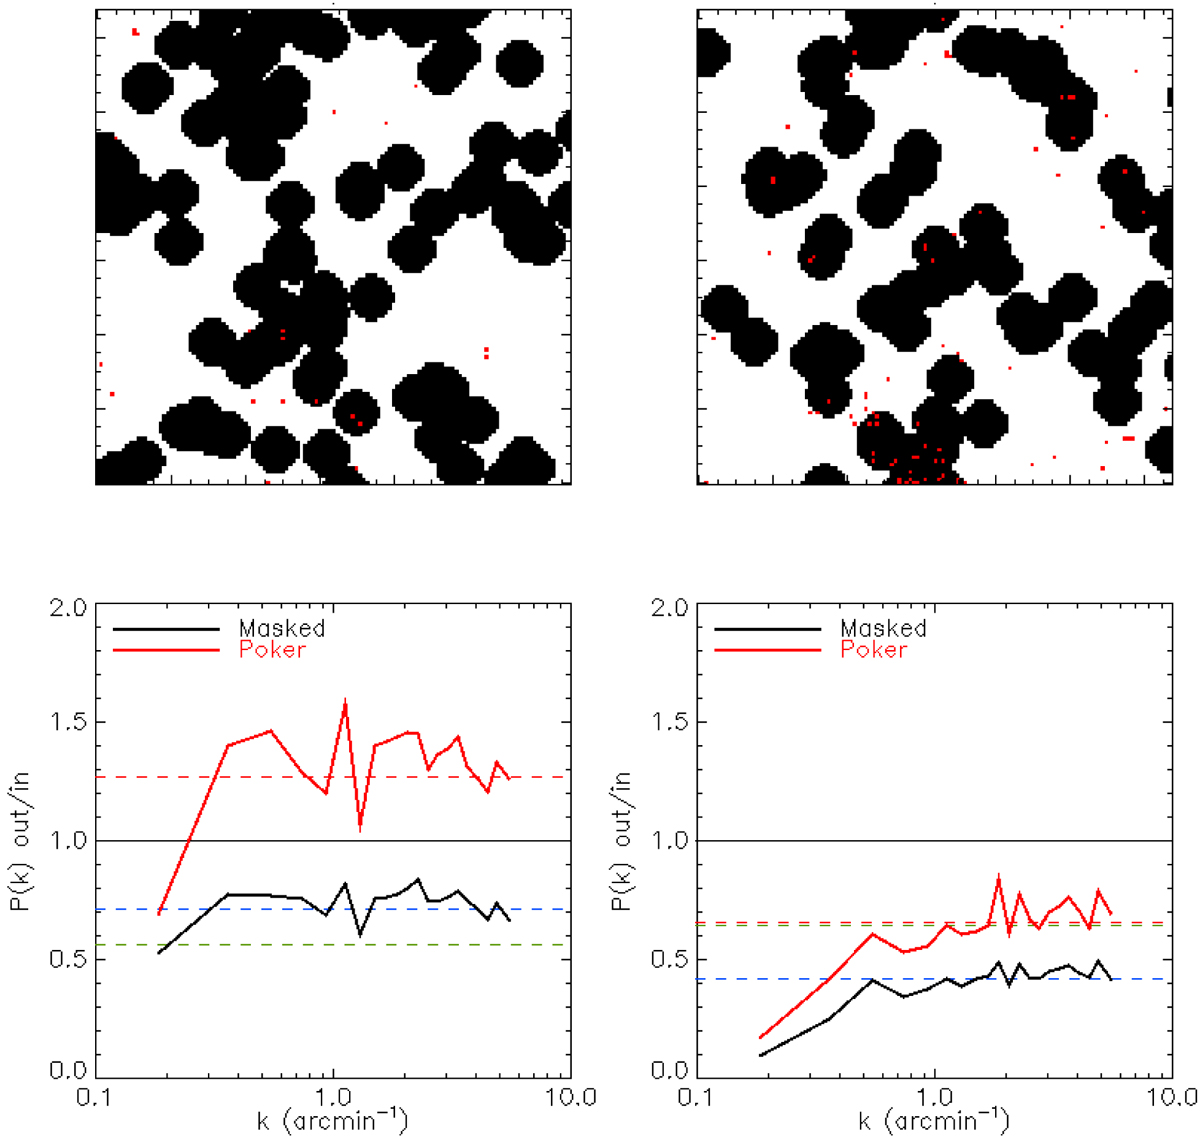
Illustration of the POKER correction for two different 114 arcmin2 fields. Top row: CO+[CI] masks corresponding to the two fields, as well as the [CII] sources (red points). Bottom row: APS of the masked [CII] source maps, with or without correction of mask aliasing (labelled ‘Poker’ and ‘Masked’, respectively). On the left-hand side, the mask covers 44% of the sky patch (dashed blue line) but masks only 29% of the [CII] sources (dashed green line). POKER returns an output power spectrum that has the correct shape (flat, up to the sample variance) but that is overestimated by a factor of (1-0.29)/(1-0.44) = 1.27. This is the dashed red line, and it matches the average level of the output APS. On the right-hand side, the mask covers only 36% of the sky patch but 58% of the sources. Hence, the output APS returned by POKER is underestimated by (1-0.58)/(1-0.36) = 0.65.
Current usage metrics show cumulative count of Article Views (full-text article views including HTML views, PDF and ePub downloads, according to the available data) and Abstracts Views on Vision4Press platform.
Data correspond to usage on the plateform after 2015. The current usage metrics is available 48-96 hours after online publication and is updated daily on week days.
Initial download of the metrics may take a while.