Fig. 6
Download original image
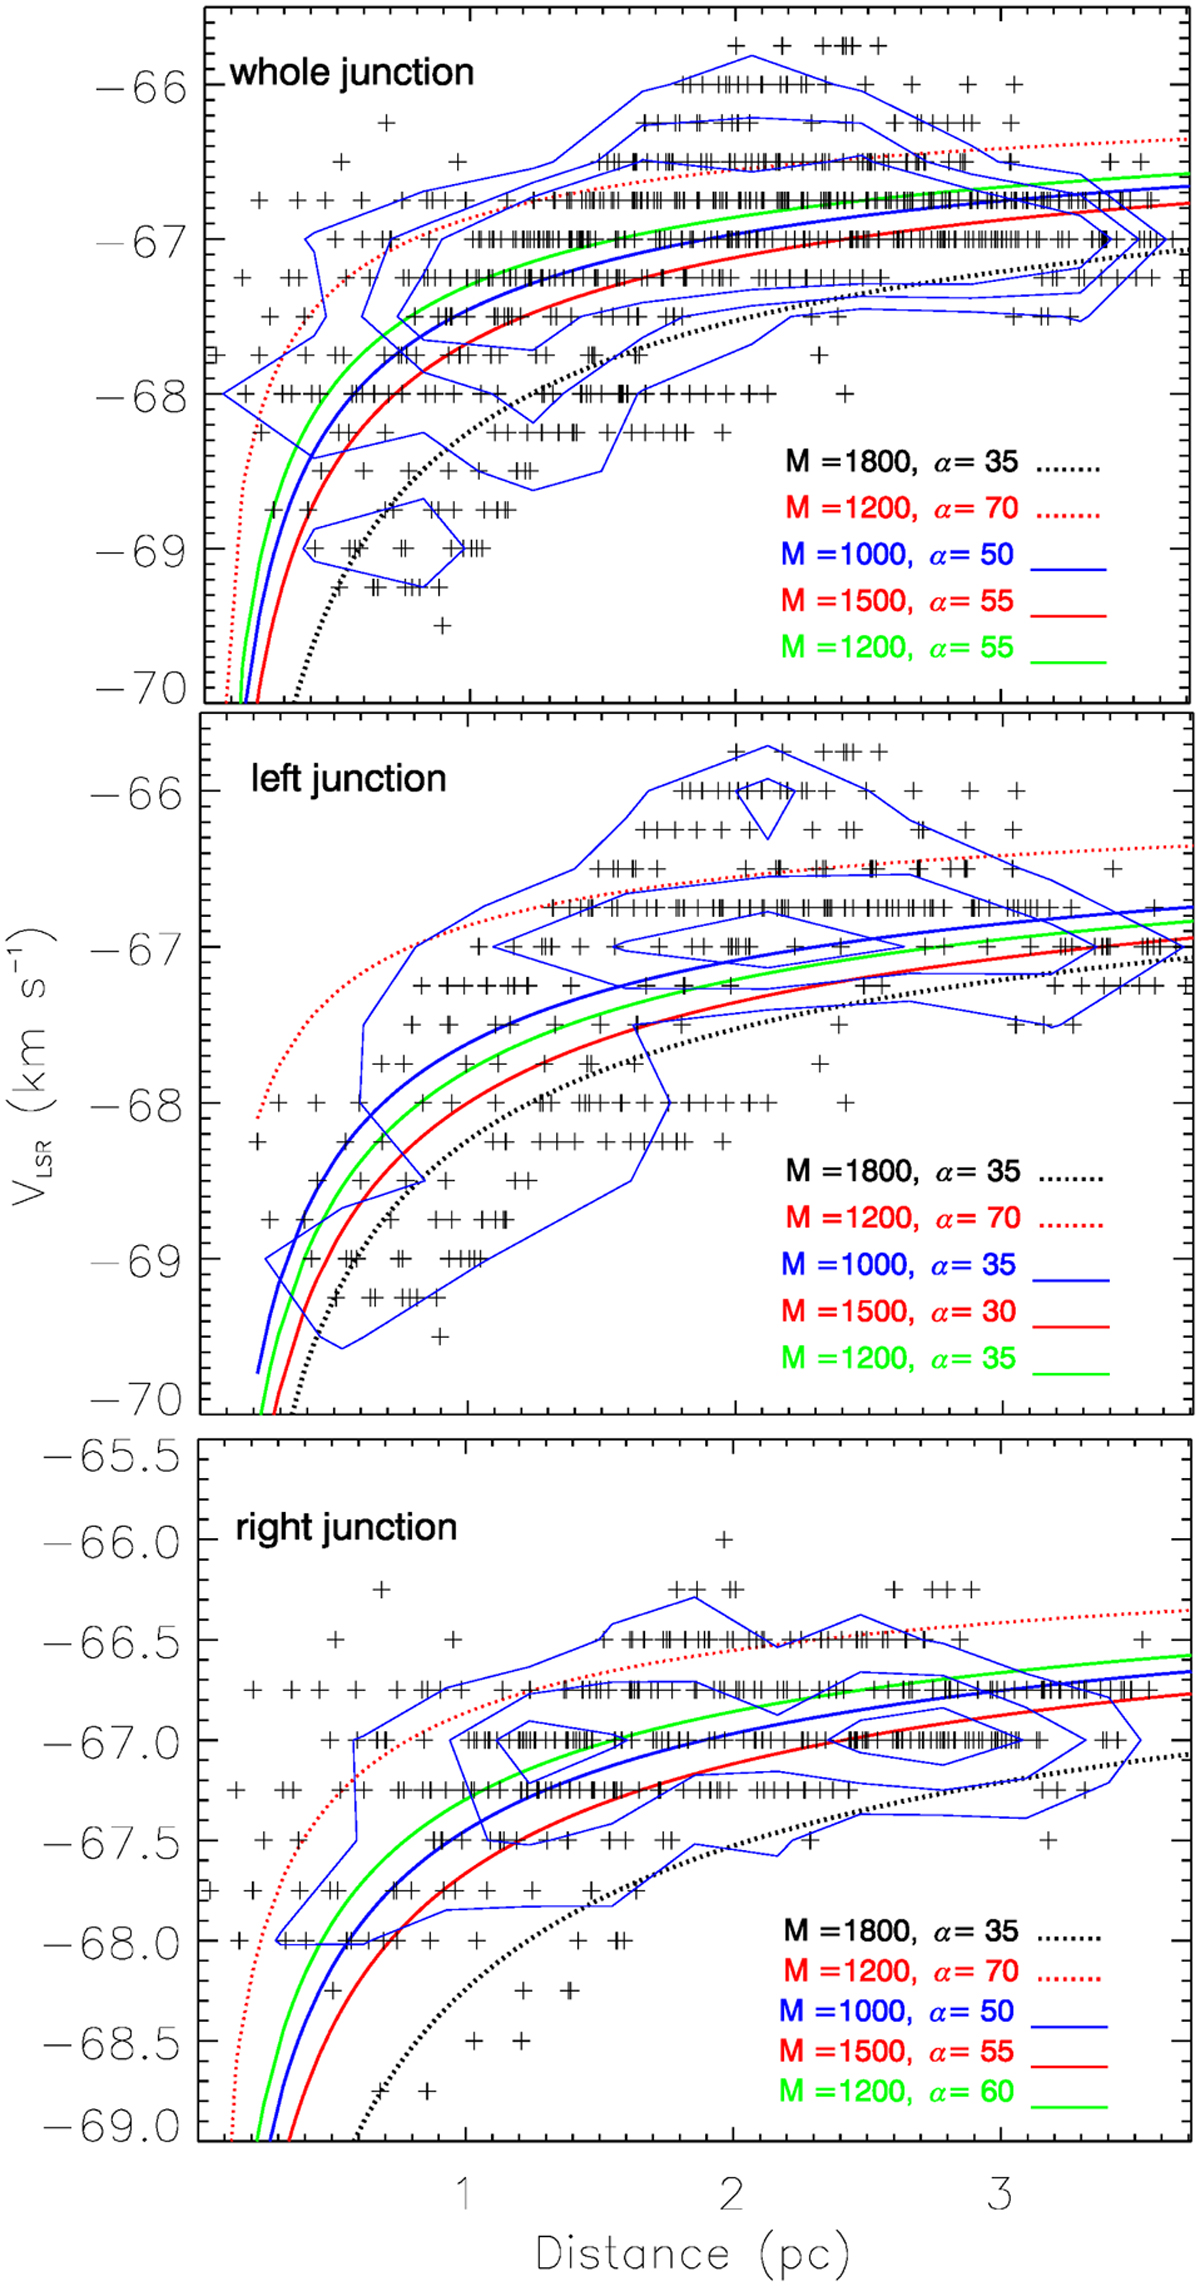
Gas velocity structure as a function of the distance to the center clump (l = 323.459°, b = −0.079°). The data points from the top to the bottom panels of the diagram are from the whole junction, the left half of the junction (l > 323.46°) and the right half of the junction (l < 323.46°), respectively. For all panels different fitted lines describe the expected velocity profile for a free-falling particle in a series of potential wells with different masses M observed at different angles α following Eq. (4). The parameters are showed at the lower right corner of each panel, the masses are in M⊙ and angles are in degrees. The blue contours are the density-plot of the cross points.
Current usage metrics show cumulative count of Article Views (full-text article views including HTML views, PDF and ePub downloads, according to the available data) and Abstracts Views on Vision4Press platform.
Data correspond to usage on the plateform after 2015. The current usage metrics is available 48-96 hours after online publication and is updated daily on week days.
Initial download of the metrics may take a while.