Fig. 5
Download original image
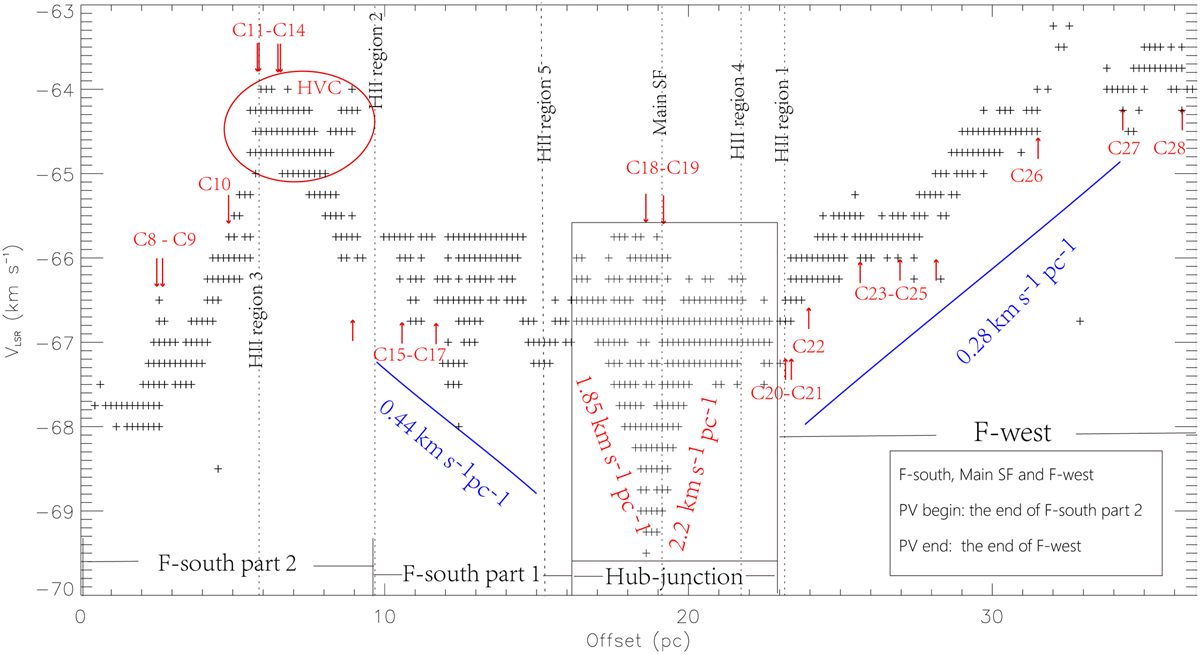
13CO (J = 2−1) line velocity along F-south to F-west. The blue lines indicate the velocity gradient in the F-west and F-south part 1. The vertical black dotted lines indicate the position of HII region along the filament, and red arrows indicate the location of the numbered pre-stellar and proto-stellar clumps located along the filament. The data points circled by the red ellipse is the HVC high-velocity component defined in the right panel of Fig. 1.
Current usage metrics show cumulative count of Article Views (full-text article views including HTML views, PDF and ePub downloads, according to the available data) and Abstracts Views on Vision4Press platform.
Data correspond to usage on the plateform after 2015. The current usage metrics is available 48-96 hours after online publication and is updated daily on week days.
Initial download of the metrics may take a while.