Open Access
Fig. 3
Download original image
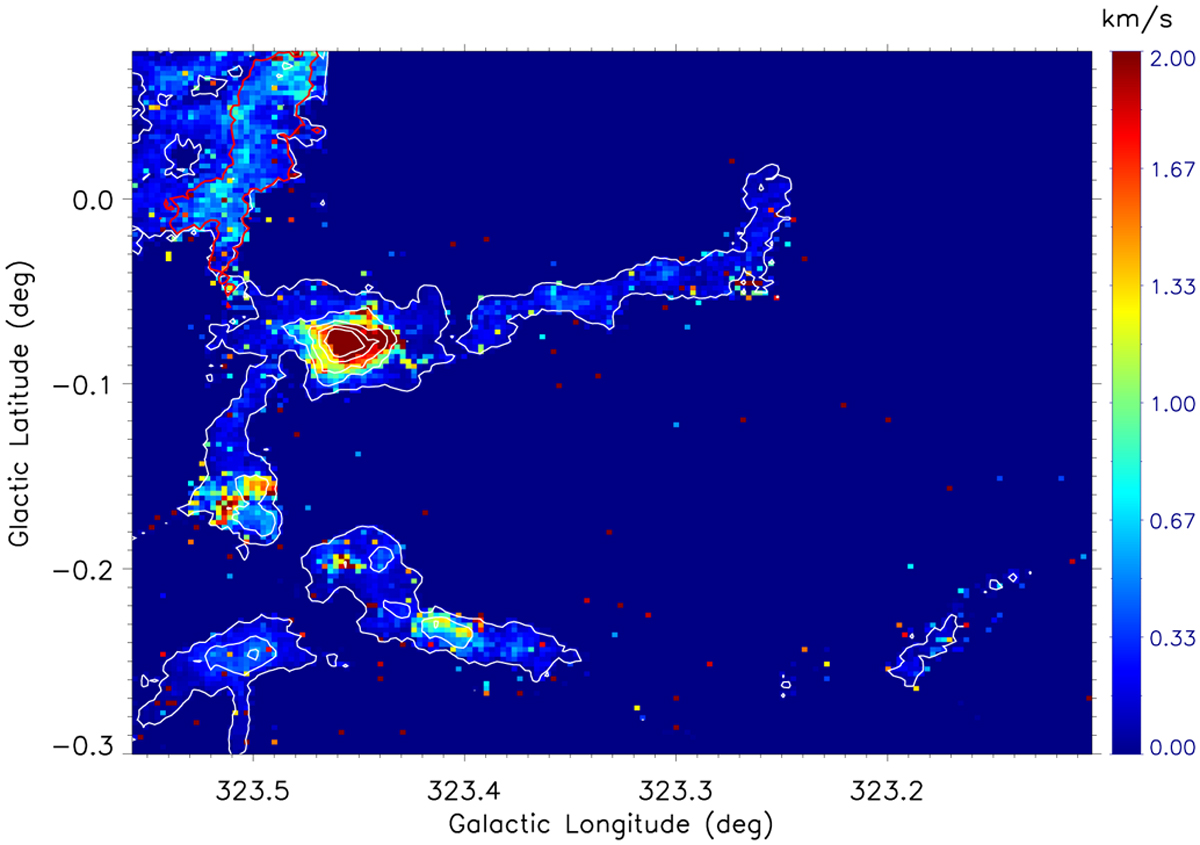
Moment 2 map of G323.46-0.08. The colour backgrounds represents the velocity dispersion of 13CO (J = 2−1). The white contours denote the 13CO (J = 2−1) emission integrated velocity from −70 to −63 km s−1, which starts from a 3σ level of 3 K km s−1 and with a step of 11.5 K km s−1.
Current usage metrics show cumulative count of Article Views (full-text article views including HTML views, PDF and ePub downloads, according to the available data) and Abstracts Views on Vision4Press platform.
Data correspond to usage on the plateform after 2015. The current usage metrics is available 48-96 hours after online publication and is updated daily on week days.
Initial download of the metrics may take a while.