Fig.2
Download original image
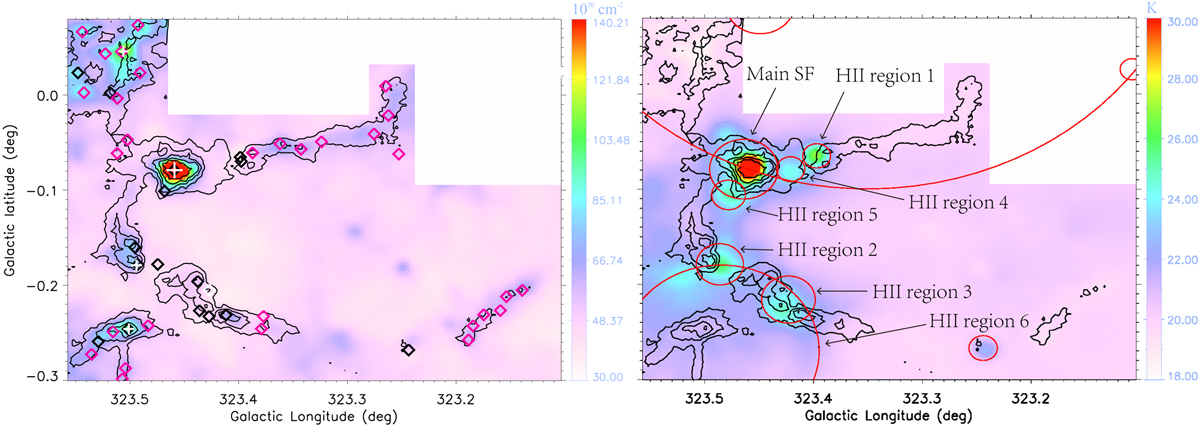
H2 column density (left) and dust temperature (right) distributions within the G323.46-0.08. The black contours indicate the 13CO (J = 2−1) integrated intensity in areas, where Tmb is higher than 3σ (3 K), The contour levels start from 3 K km s−1 and with a step of 9 K km s−1. The velocity interval of the integration is from −70 to −63 km s−1. The white, rose, and black diamonds are Herschel clumps, and represent different evolution stages of starless cores, prestellar, and protostellar, respectively (Elia et al. 2017). The white crosses are ATLASGAL 870 µm clumps (Urquhart et al. 2018). The red circles show the HII regions identified by Anderson et al. (2014).
Current usage metrics show cumulative count of Article Views (full-text article views including HTML views, PDF and ePub downloads, according to the available data) and Abstracts Views on Vision4Press platform.
Data correspond to usage on the plateform after 2015. The current usage metrics is available 48-96 hours after online publication and is updated daily on week days.
Initial download of the metrics may take a while.