Fig. 1
Download original image
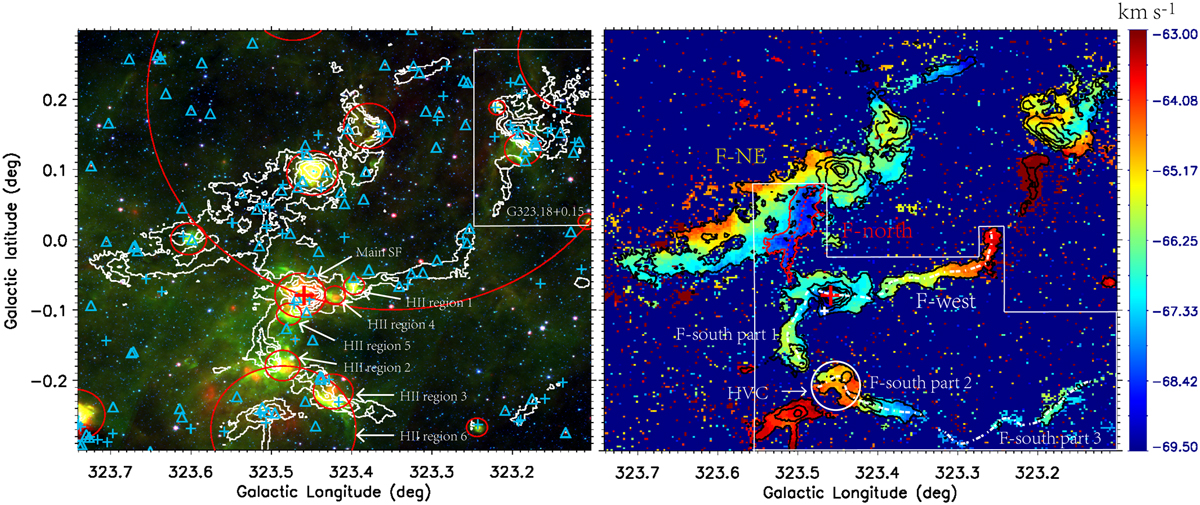
Infrared and molecular spectrum line emissions of G323.46-0.08. Left: three-color map of the G323.46-0.08 region. Red, green, and blue backgrounds show the 24, 8, and 4.5 µm emission, respectively. The white contours denote the 13CO (J = 2−1) emission integrated velocity from −70 to −63 km s−1, which starts from 3 K km s−1 and with a step of 9 K km s−12. The cyan crosses and triangles are Class I and II YSOs, respectively. The red circles mark the Hπ regions identified by Anderson et al. (2014). The red cross is the central high mass clump AGAL323.459-0.079 in hub-filament system G323.46-0.08. Right: velocity map of G323.46-0.08. The color background is the velocity field of 13CO (J = 2−1). The black contours are the integrated intensity of the 13CO (J = 2−1) emission (same as in the left panel). The red contour marks the 13CO (J = 2−1) emission in the region of F-north integrated velocity from −70 to −68.25 km s−1. The red dotted line and the white interrupted dashed line represent the ridgeline of F-north, F-west, and F-south. All ridge lines are formed by connecting the peak intensity points of 13CO (J = 2−1) in the filament). The white circle denotes the high velocity component appears in F-south part 2.
Current usage metrics show cumulative count of Article Views (full-text article views including HTML views, PDF and ePub downloads, according to the available data) and Abstracts Views on Vision4Press platform.
Data correspond to usage on the plateform after 2015. The current usage metrics is available 48-96 hours after online publication and is updated daily on week days.
Initial download of the metrics may take a while.