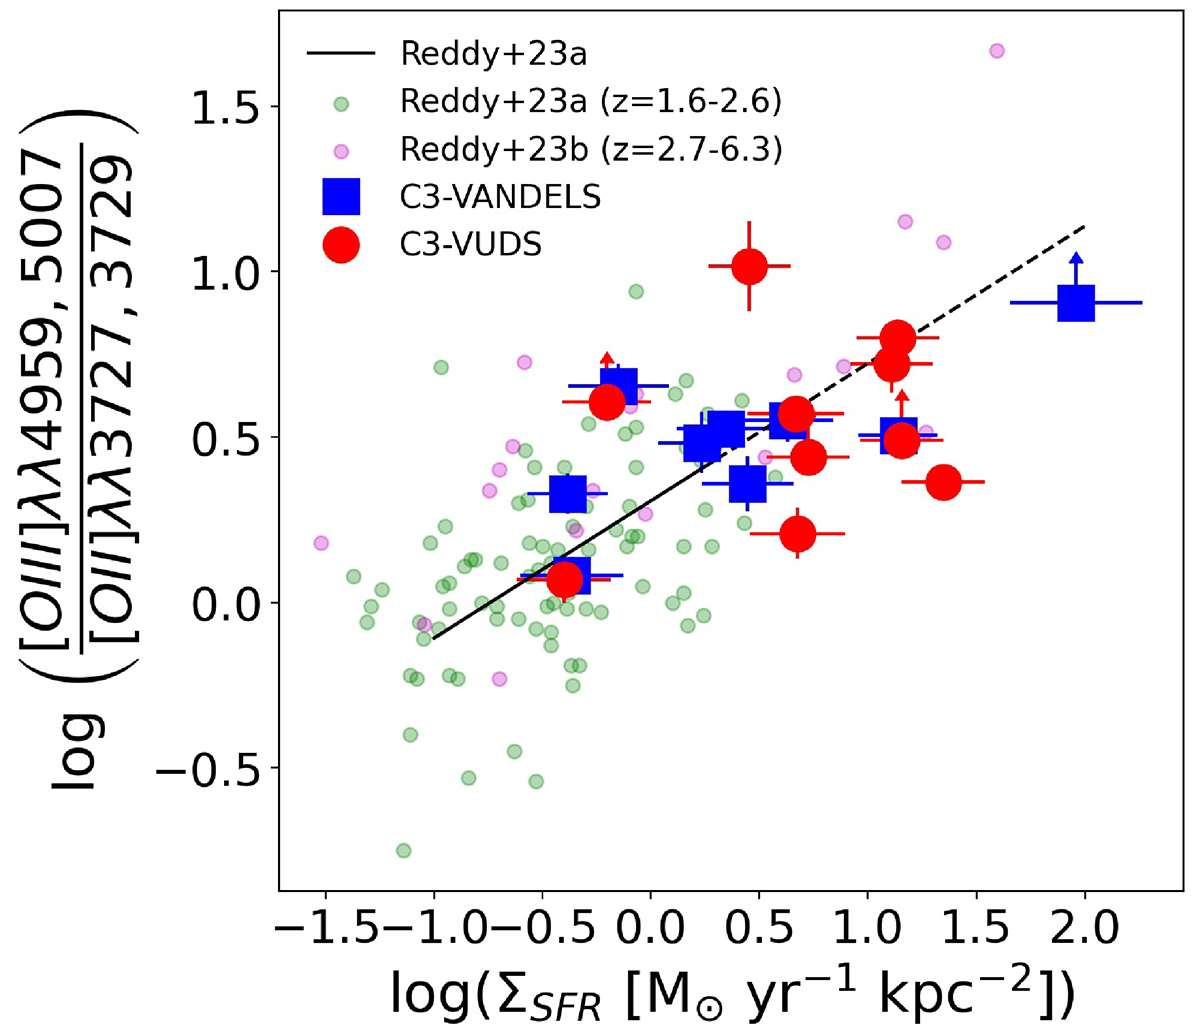
Fig. 8.
Download original image
Variation in [OIII]/[OII] with ΣSFR. Individual galaxies with detected [OII] are shown with red and blue symbols for the C3-VUDS and C3-VANDELS samples, respectively. We also include lower limits based on the upper limits on [OII]. The small green and magenta circles are galaxies from Reddy et al. (2023a) at z = 1.6 − 2.6 and Reddy et al. (2023b) at z = 2.7 − 6.3, respectively. The solid black line is the relation presented in Reddy et al. (2023a), and its extrapolation up to ΣSFR = 100 M⊙ yr−1 kpc−2 is plotted as the dashed black line.
Current usage metrics show cumulative count of Article Views (full-text article views including HTML views, PDF and ePub downloads, according to the available data) and Abstracts Views on Vision4Press platform.
Data correspond to usage on the plateform after 2015. The current usage metrics is available 48-96 hours after online publication and is updated daily on week days.
Initial download of the metrics may take a while.