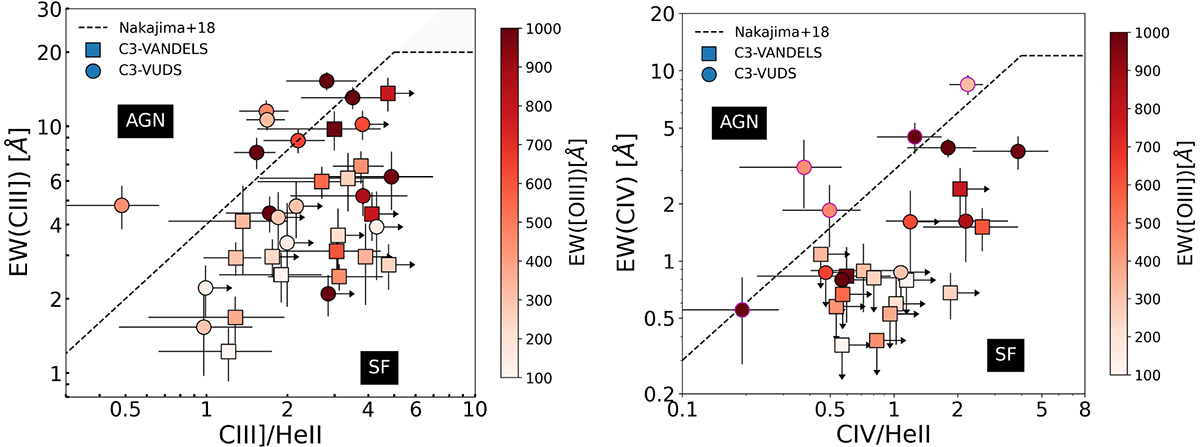
Fig. 6.
Download original image
UV diagnostic diagrams for our sample based on the EWs of CIII] (left) and CIV (right). In both panels, our sample is color-coded by EW([OIII]), and the dashed black lines are the demarcation between AGN (on the left) and SF (on the right) according to Nakajima et al. (2018). In the right panel, the symbols with magenta edges are galaxies classified as AGN according to the EW(CIII])–CIII]/HeII diagram.
Current usage metrics show cumulative count of Article Views (full-text article views including HTML views, PDF and ePub downloads, according to the available data) and Abstracts Views on Vision4Press platform.
Data correspond to usage on the plateform after 2015. The current usage metrics is available 48-96 hours after online publication and is updated daily on week days.
Initial download of the metrics may take a while.