Fig. 2.
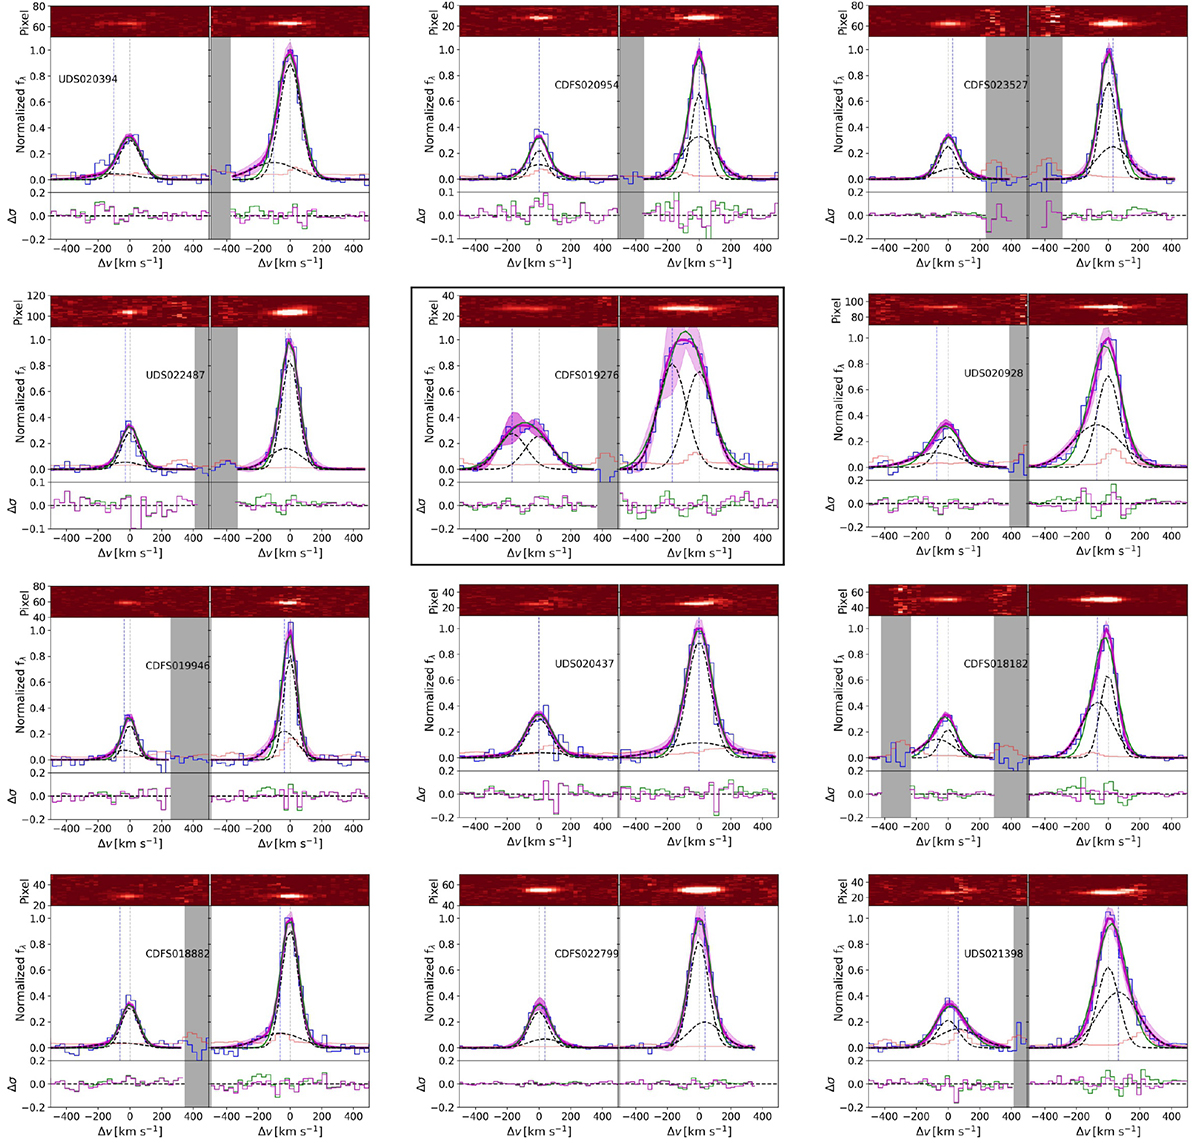
Download original image
Best-fit of the [OIII] profiles from the C3-VANDELS sample with ΔBIC > 2. The panels show single galaxies ordered by EW(CIII]) from left to right and top to bottom. At the top in each panel, we show the 2D spectrum with the detected lines. In the middle, we plot the models for [OIII]λ4959 (left) [OIII]λ5007 (right). The blue line shows the observed spectrum, and the red line shows the error spectrum. The Gaussian lines are normalized to the intensity peak of [OIII]λ5007. The dashed black lines are the narrow and broad components, and the magenta line is the global fit considering both components. The magenta-shaded region is the 3σ uncertainty of the fit. The green line is the single-Gaussian fit. The vertical gray line marks the systemic velocity traced by the peak intensity of the narrow component. The vertical blue line marks the peak intensity of the broad component. Bottom: The residuals (Δσ) for each model are shown with the same colors. The gray-shaded regions are masked regions due to sky residuals. The galaxies in the black square show two narrow components.
Current usage metrics show cumulative count of Article Views (full-text article views including HTML views, PDF and ePub downloads, according to the available data) and Abstracts Views on Vision4Press platform.
Data correspond to usage on the plateform after 2015. The current usage metrics is available 48-96 hours after online publication and is updated daily on week days.
Initial download of the metrics may take a while.