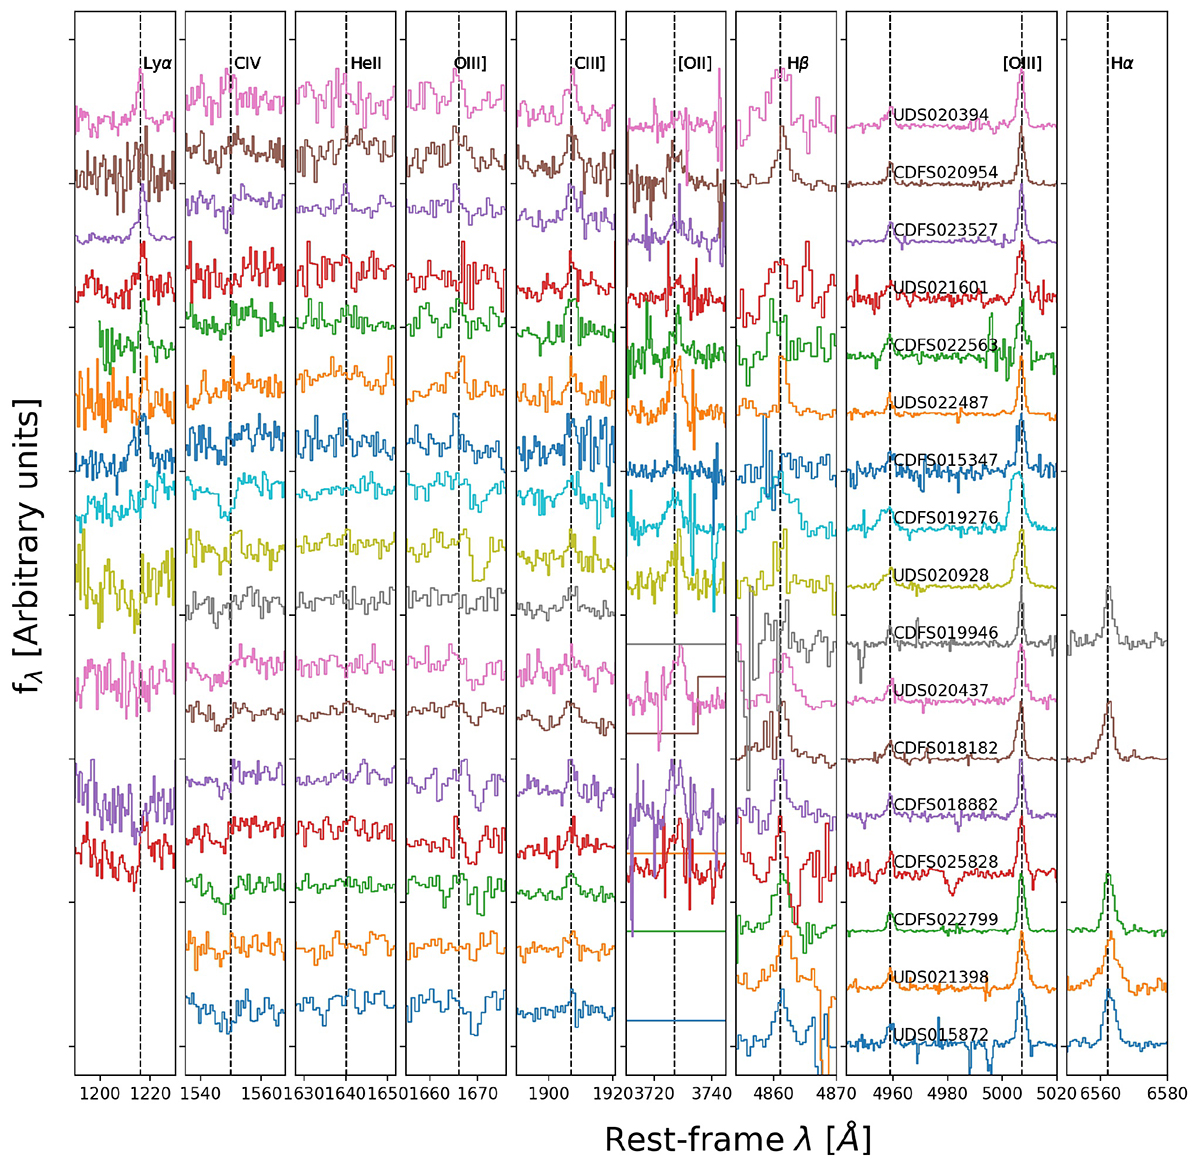
Fig. A.1.
Download original image
Rest-frame spectra of the galaxies in the C3-VANDELS subsample. From the left to right panels, we highlight the following emission lines (which are marked with the dashed black line): Lyα, CIVλλ1548,51, HeIIλ1640, OIII]λλ1661,66, CIII]λλ1907,09, [OII]λλ3727,3729, Hβ, [OIII]λλ4959,5007, and Hα. The flux density is in arbitrary units. Each galaxy is shown with the same color in each panel, and its ID is plotted in the [OIII]λλ4959,5007 panel.
Current usage metrics show cumulative count of Article Views (full-text article views including HTML views, PDF and ePub downloads, according to the available data) and Abstracts Views on Vision4Press platform.
Data correspond to usage on the plateform after 2015. The current usage metrics is available 48-96 hours after online publication and is updated daily on week days.
Initial download of the metrics may take a while.