Fig. 17.
Download original image
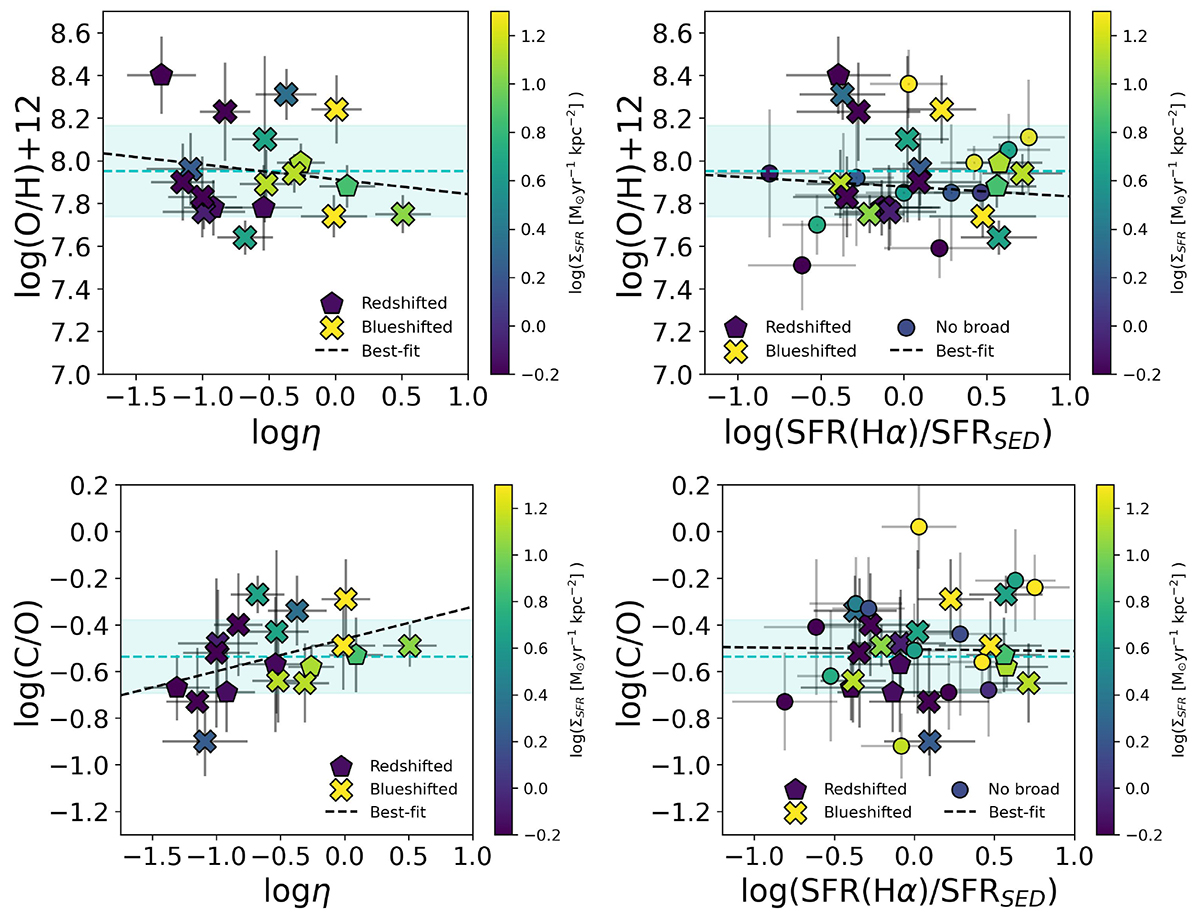
Relation of the chemical abundances (oxygen abundance in the top panels and C/O in the bottom panels) with the mass-loading factor (left panels) and with burstiness (right panels). Our sample is divided into galaxies in which the broad component is blueshifted (blue crosses) or redshifted (red pentagons) or for which no broad component was detected (black squares). The dashed cyan lines are the mean value, and the shaded region is the mean observed scatter. Our sample is color-coded by ΣSFR.
Current usage metrics show cumulative count of Article Views (full-text article views including HTML views, PDF and ePub downloads, according to the available data) and Abstracts Views on Vision4Press platform.
Data correspond to usage on the plateform after 2015. The current usage metrics is available 48-96 hours after online publication and is updated daily on week days.
Initial download of the metrics may take a while.