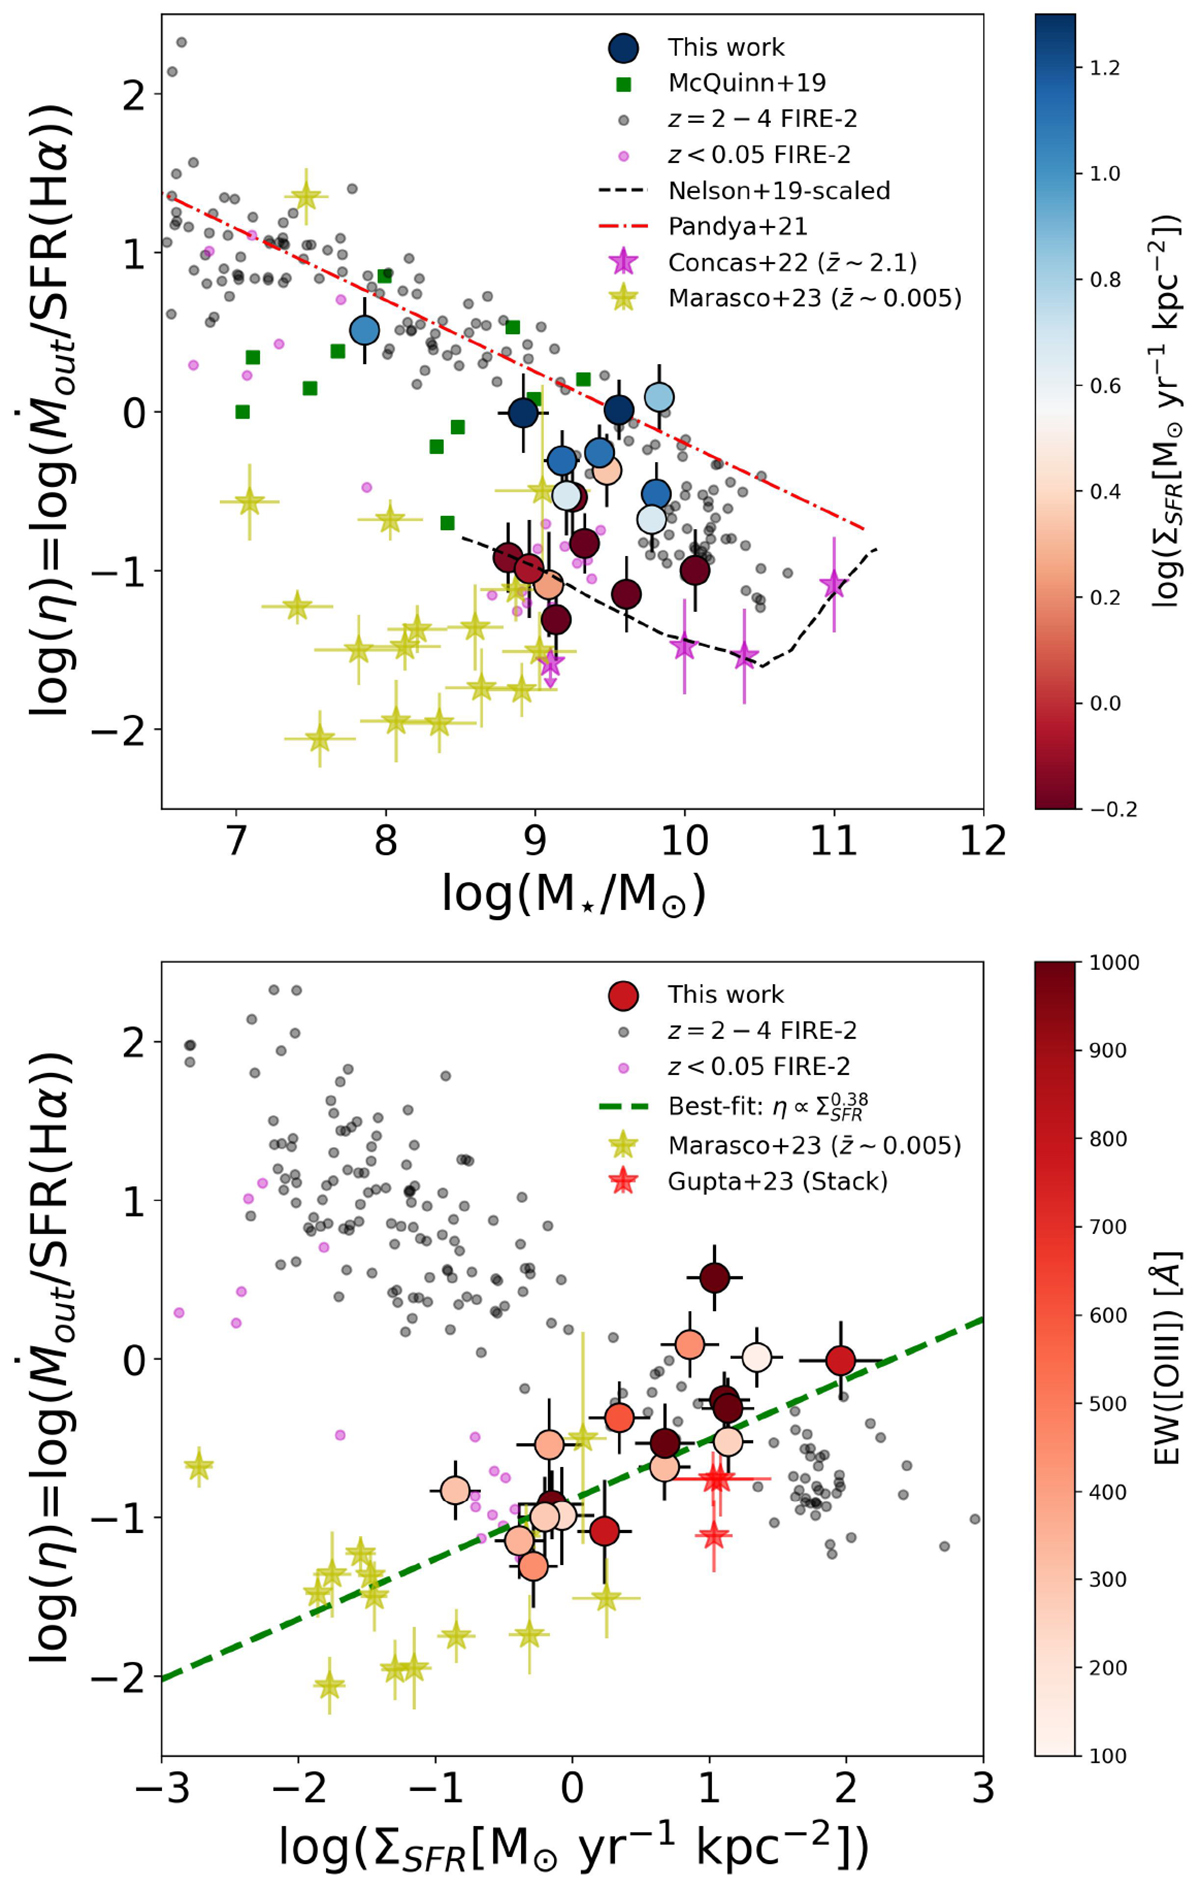
Fig. 16.
Download original image
Relation between the mass-loading factor, stellar mass and ΣSFR. Top panel: Relation between the mass-loading factor and stellar mass. Our sample is color-coded by ΣSFR. The dashed black line is the rescaled relation found in simulations according to Nelson et al. (2019b). The dot-dashed line is the relation found in Pandya et al. (2021). The small black (magenta) circles are single simulated halos from Pandya et al. (2021) in the redshift range 2–4 (< 0.05). We also include observational results from McQuinn et al. (2019), Concas et al. (2022), and Marasco et al. (2023). Bottom panel: Relation between the mass-loading factor and ΣSFR. The symbols are the same as in the top panel, but our sample is color-coded by EW([OIII]). The red stars are stacks at z = 3 − 4 from Gupta et al. (2023). The dashed green line is the best fit for log(ΣSFR[M⊙ yr−1 kpc−2]) > −3 including our sample and the observed galaxies and stacks from literature.
Current usage metrics show cumulative count of Article Views (full-text article views including HTML views, PDF and ePub downloads, according to the available data) and Abstracts Views on Vision4Press platform.
Data correspond to usage on the plateform after 2015. The current usage metrics is available 48-96 hours after online publication and is updated daily on week days.
Initial download of the metrics may take a while.