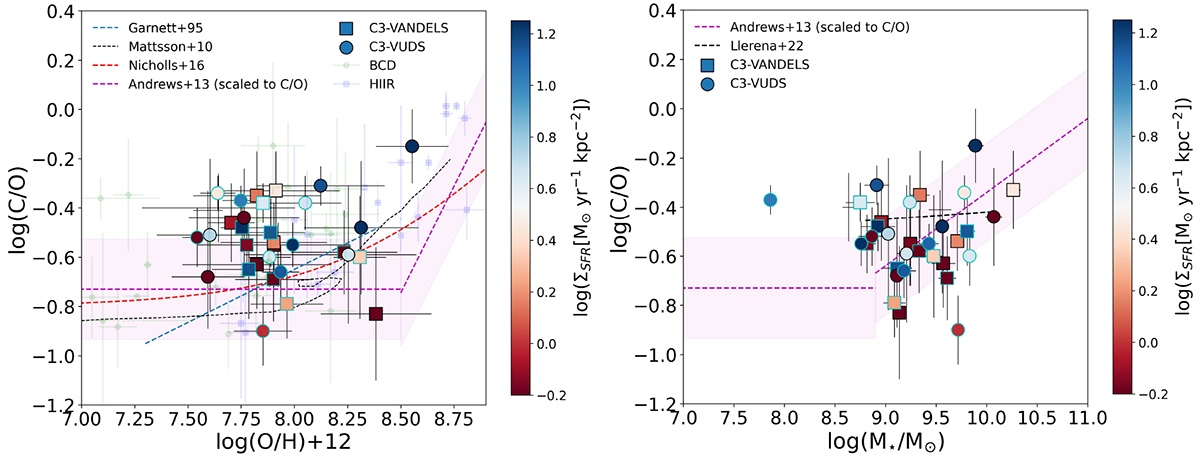
Fig. 15.
Download original image
Relation between C/O, O/H and stellar mass. Left panel: C/O–O/H relation. Our sample is color-coded by ΣSFR. The symbols with cyan edges are galaxies with limits in OIII]λ1666. We compare our results with local BCD galaxies (small green circles; Garnett et al. 1995, 1997; Kobulnicky et al. 1997; Kobulnicky & Skillman 1998; Izotov et al. 1999; Thuan et al. 1999; Berg et al. 2016; Senchyna et al. 2021) and HII regions (small blue squares; Garnett et al. 1995, 1999; Kurt et al. 1995; Mattsson 2010; Senchyna et al. 2021). We also show chemical evolution models from the literature as dashed lines with the colors described in the legend (Garnett et al. 1995; Mattsson 2010; Nicholls et al. 2017). The dashed magenta line is the scaled N/O-mass relation in Andrews & Martini (2013) assuming the constant C/N factor based on Berg et al. (2019). The shaded magenta region is the 1σ uncertainty considering the observed scatter in the relation and the conversion factor. Right panel: Relation between C/O and stellar mass. The symbols are the same as in the left panel. In this panel, the dashed black line is the relation presented in Llerena et al. (2022) at z ∼ 3 based on stacking.
Current usage metrics show cumulative count of Article Views (full-text article views including HTML views, PDF and ePub downloads, according to the available data) and Abstracts Views on Vision4Press platform.
Data correspond to usage on the plateform after 2015. The current usage metrics is available 48-96 hours after online publication and is updated daily on week days.
Initial download of the metrics may take a while.