Fig. 13.
Download original image
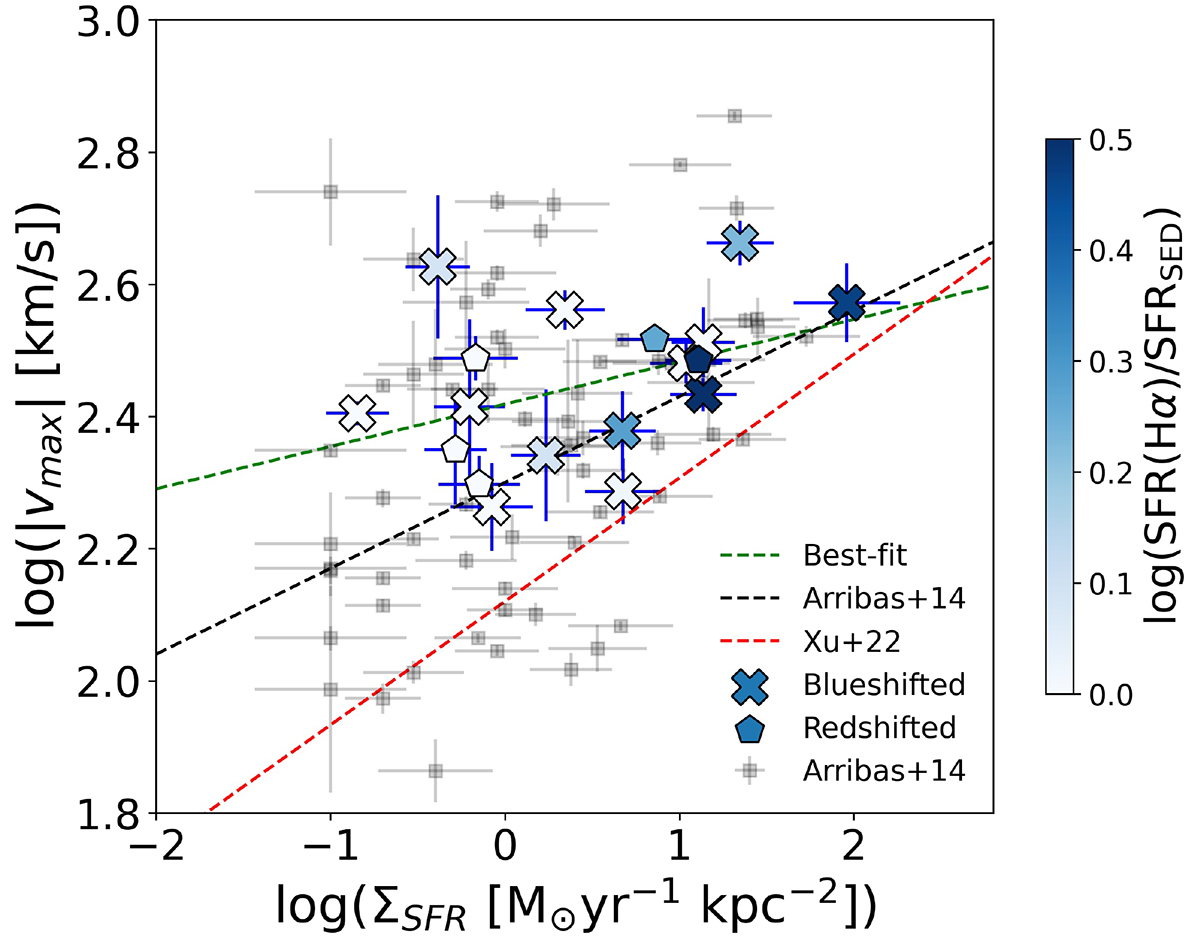
Relation between outflow velocity and ΣSFR. Our sample is color-coded by the SFR(Hβ)/SFRSED ratio. Our sample is divided into galaxies with blue- (crosses) and redshifted (pentagons) broad components. The dashed black line corresponds to the best slope from Arribas et al. (2014), and the black squares show their observed data. The dashed green line is our best fit. The dashed red line is the best fit from Xu et al. (2022b). Two galaxies with broad components (CDFS023527 and 511245444) are excluded from this plot because Hα and Hβ are not included in the observed spectral range.
Current usage metrics show cumulative count of Article Views (full-text article views including HTML views, PDF and ePub downloads, according to the available data) and Abstracts Views on Vision4Press platform.
Data correspond to usage on the plateform after 2015. The current usage metrics is available 48-96 hours after online publication and is updated daily on week days.
Initial download of the metrics may take a while.