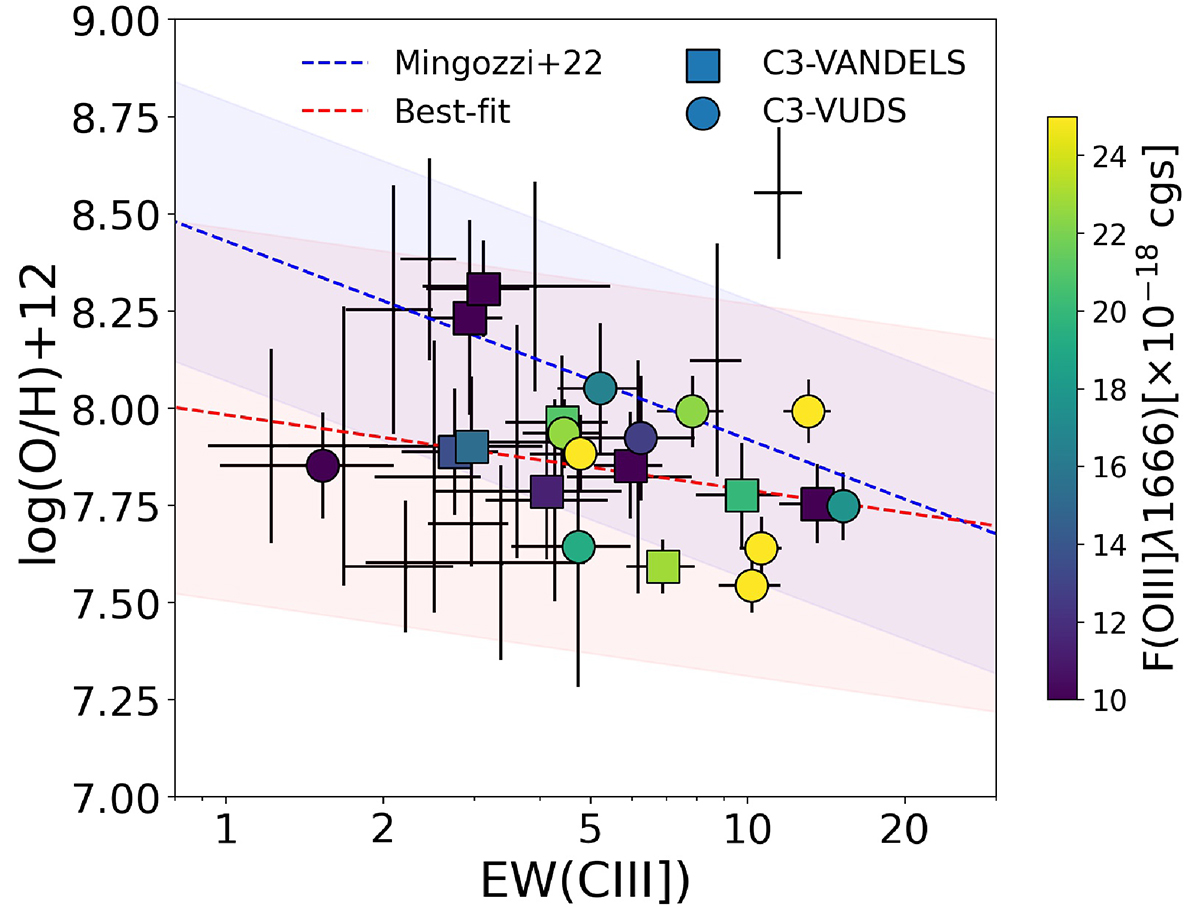
Fig. 11.
Download original image
Relation between gas-phase metallicity and EW(CIII]) for our sample. The dashed blue line and shaded blue region correspond to the relation found in Mingozzi et al. (2022) at low z and their observed 2σ scatter. The dashed red line is our best fit, and the observed 2σ scatter is the shaded red region. The sample is color-coded by OIII] flux when this line is detected at an S/N > 2. In the other cases, only error bars are shown.
Current usage metrics show cumulative count of Article Views (full-text article views including HTML views, PDF and ePub downloads, according to the available data) and Abstracts Views on Vision4Press platform.
Data correspond to usage on the plateform after 2015. The current usage metrics is available 48-96 hours after online publication and is updated daily on week days.
Initial download of the metrics may take a while.