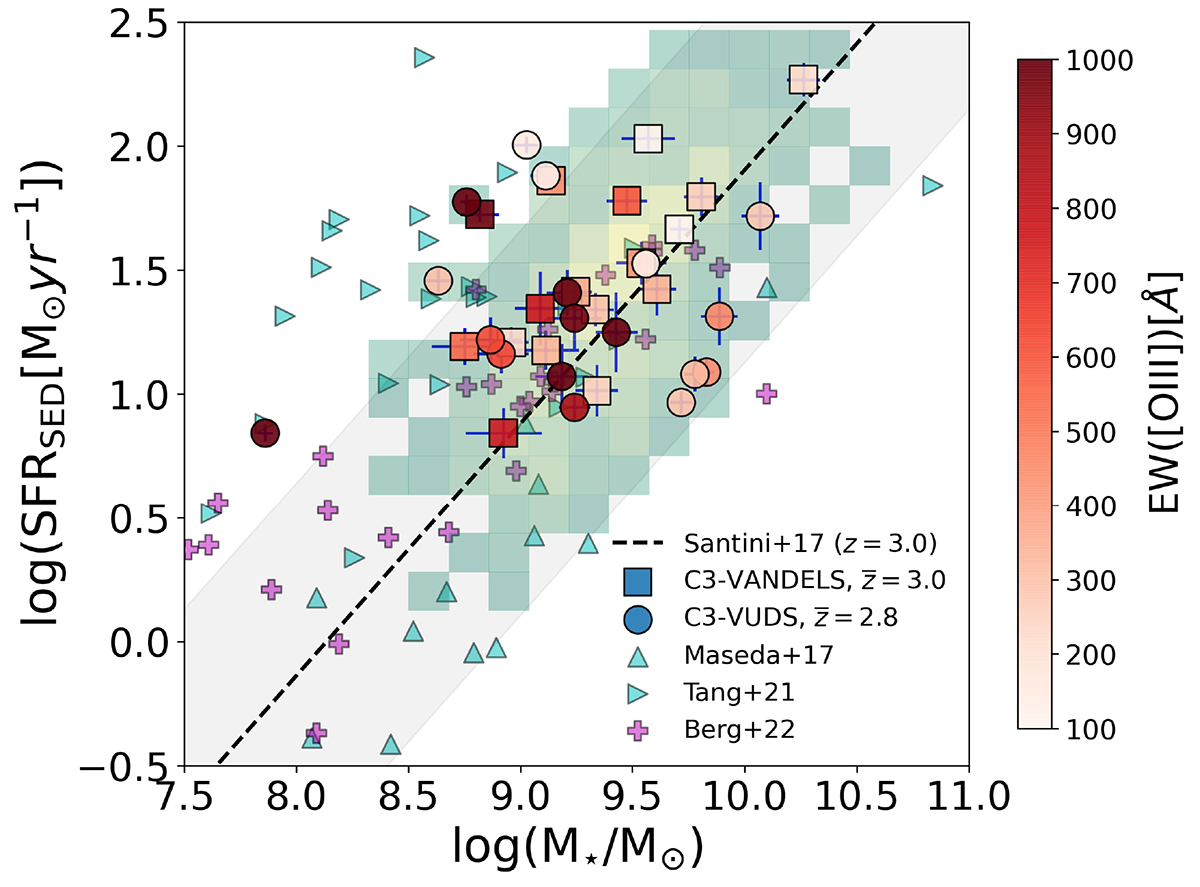
Fig. 1.
Download original image
Sample distributed along the star-forming main sequence at z ∼ 3 color-coded by EW([OIII]). The 2D histogram corresponds to the VANDELS parent sample at the same redshift range, and the dashed black line is the main sequence according to Santini et al. (2017). The magenta crosses and cyan triangles are reference samples at low (Berg et al. 2022) and intermediate redshifts (Maseda et al. 2017; Tang et al. 2021), respectively (see Sect. 3.1).
Current usage metrics show cumulative count of Article Views (full-text article views including HTML views, PDF and ePub downloads, according to the available data) and Abstracts Views on Vision4Press platform.
Data correspond to usage on the plateform after 2015. The current usage metrics is available 48-96 hours after online publication and is updated daily on week days.
Initial download of the metrics may take a while.