Fig. 7
Download original image
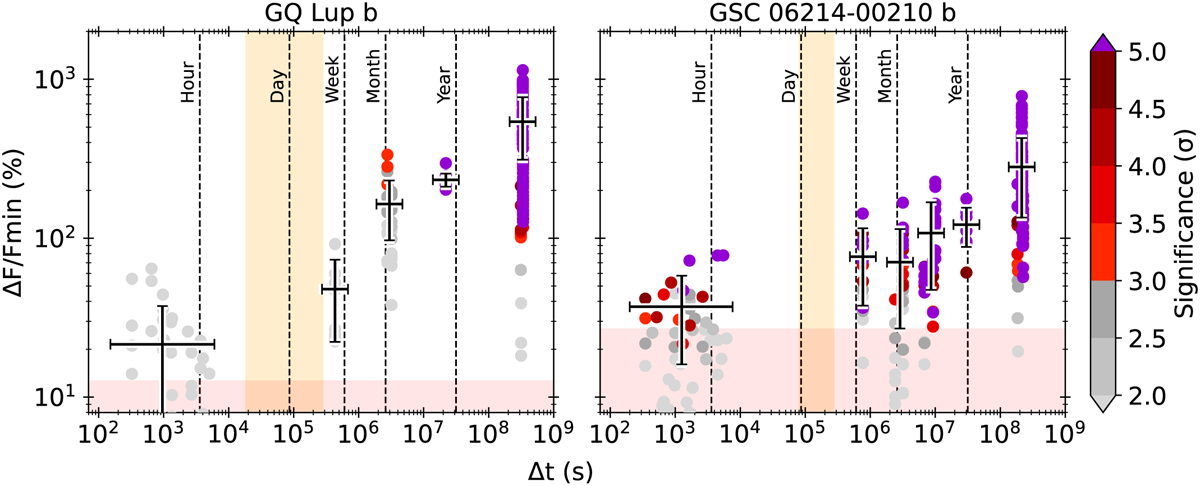
Paβ flux variability for both sources, as a function of the timescale, with respect to the lowest-flux point of the pair. For GQ Lup b, are included data points from this study as well as the spectrum from Lavigne et al. (2009). For GSC06214b, are included data points from this study as well as those from the individual Bowler data cubes (Bowler et al. 2011) and the mean spectrum from Lachapelle et al. (2015). The color of the points represents the significance of the measurement, i.e., the σ-distance between the two lines used to compute this value. The horizontal and vertical bars correspond respectively to the bin size, and the spread (weighted by significance) within that bin. The red-shaded regions mark the average observed continuum variability among the SINFONI sequences (see Table ). The orange shaded regions represent the expected rotational period of the objects (see Sect. 2).
Current usage metrics show cumulative count of Article Views (full-text article views including HTML views, PDF and ePub downloads, according to the available data) and Abstracts Views on Vision4Press platform.
Data correspond to usage on the plateform after 2015. The current usage metrics is available 48-96 hours after online publication and is updated daily on week days.
Initial download of the metrics may take a while.