Fig. 6
Download original image
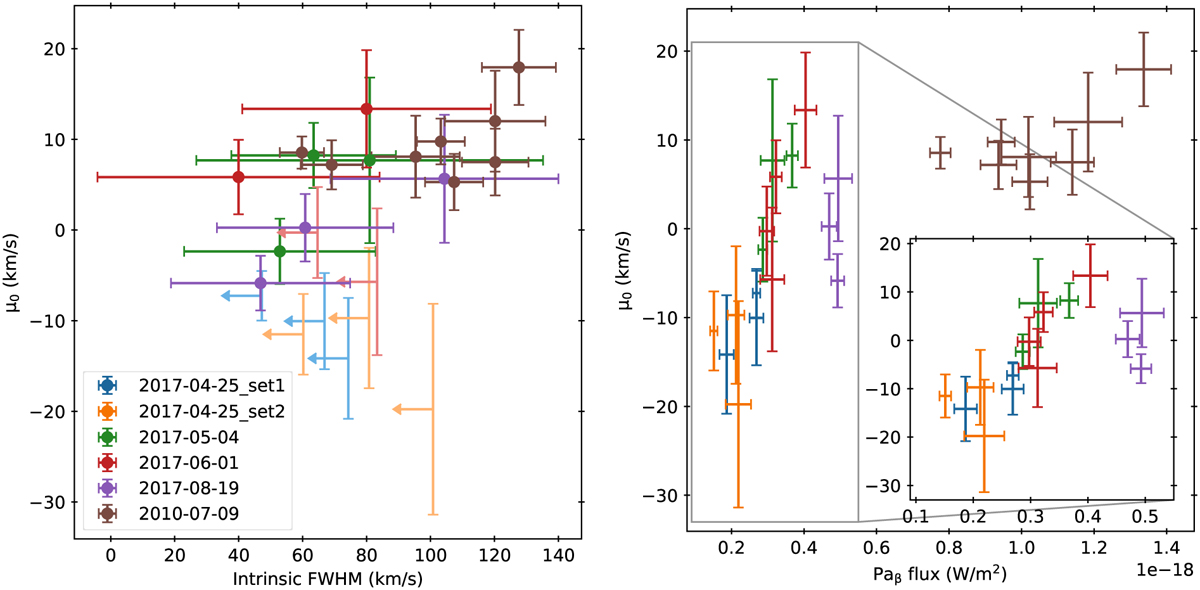
Gaussian-fitting resulting parameters for the Paβ line of GSC06214b. Left: correlations between intrinsic FWHM and the line peak location µ0, arrows represent an upper limit on the intrinsic FWHM. Right: correlations between the Paβ line flux and the line peak location µ0. The intrinsic FWHM is computed as the square root of the quadratic difference between the measured line FWHM and the LSF FWHM. The µ0 parameter is relative to the line expected wavelength in vacuum (1.2821578 µm).
Current usage metrics show cumulative count of Article Views (full-text article views including HTML views, PDF and ePub downloads, according to the available data) and Abstracts Views on Vision4Press platform.
Data correspond to usage on the plateform after 2015. The current usage metrics is available 48-96 hours after online publication and is updated daily on week days.
Initial download of the metrics may take a while.