Open Access
Fig. 5
Download original image
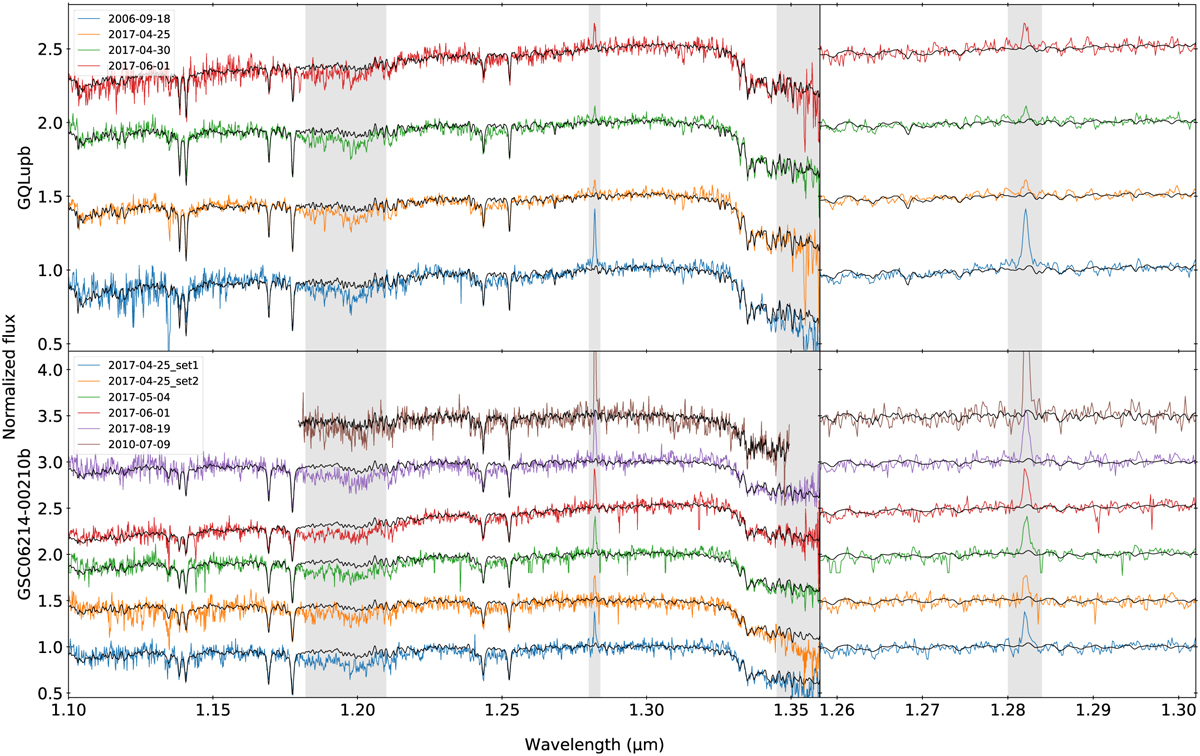
Visual comparison of the photosphere fitting with ForMoSA, for each epoch of both objects, with a zoom on Paß in the right column. Grayed-out wavelength ranges were excluded from fitting as the model either did not include corresponding species (FeH absorption band, Paß) or the data were too noisy (>1.34 µm).
Current usage metrics show cumulative count of Article Views (full-text article views including HTML views, PDF and ePub downloads, according to the available data) and Abstracts Views on Vision4Press platform.
Data correspond to usage on the plateform after 2015. The current usage metrics is available 48-96 hours after online publication and is updated daily on week days.
Initial download of the metrics may take a while.