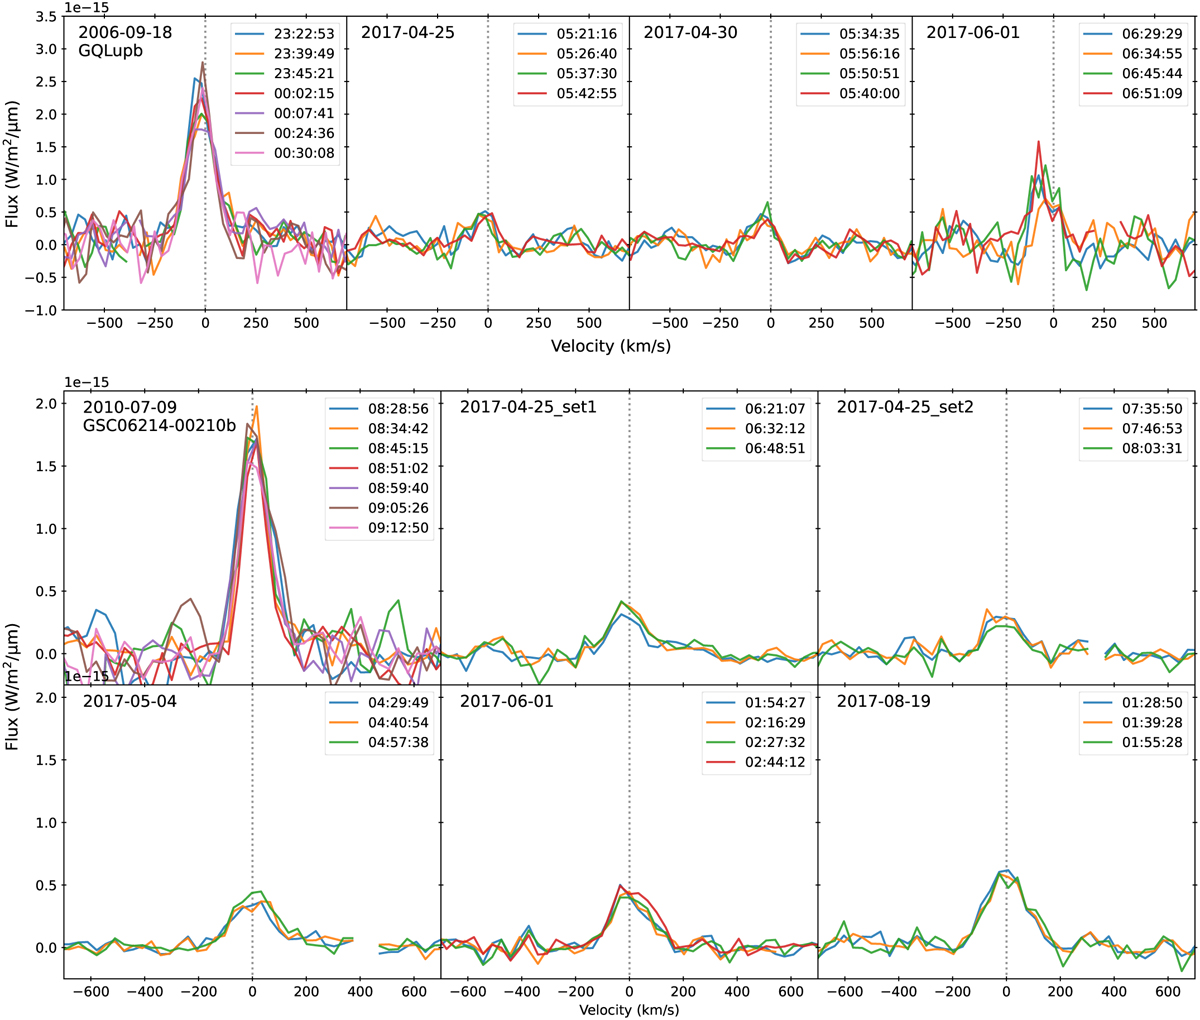
Fig. 3
Download original image
Paß profiles, corrected from the atmospheric contribution and baseline subtracted (see Sects. 5.2 and 5.3). Each spectrum is labeled with the corresponding UT time at the start of the integration. First row: GQ Lup b lines for each epoch. Second and third rows: Same but for GSC06214b, with the addition of the individual OSIRIS lines from Bowler et al. (2011) (2010-07-09 epoch).
Current usage metrics show cumulative count of Article Views (full-text article views including HTML views, PDF and ePub downloads, according to the available data) and Abstracts Views on Vision4Press platform.
Data correspond to usage on the plateform after 2015. The current usage metrics is available 48-96 hours after online publication and is updated daily on week days.
Initial download of the metrics may take a while.