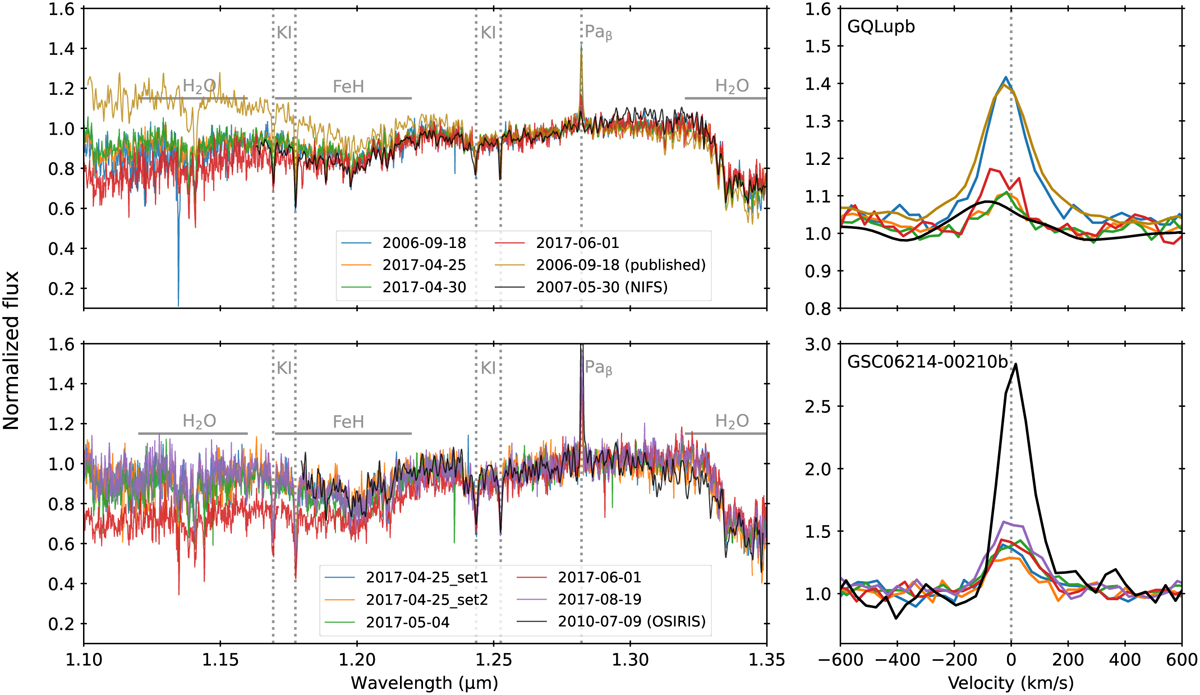
Fig. 2
Download original image
Companion spectra. Top row: GQ Lup b spectra. Bottom row: GSC 06214-00210 b spectra. Left column: full spectra. Right column: Zoom on the Paβ line. In both cases, the spectra continuum are normalized to 1 as the mean value on the 1.27–1.28 µm and 1.29–1.30 µm ranges. The 2010-07-09 (OSIRIS) epoch of GSC06214b was degraded to SINFONI resolution (R = 1800) in the left column, but is shown at full resolution (R = 3800) in the right column. The spectral slopes differences are the results of different Strehl Ratios between epochs, despite the AO correction. Our re-extraction of GQ Lup b spectrum initially presented in Seifahrt et al. (2007) produces a pseudo-continuum short-wards of 1.24 µm that is in better agreement with the more recent SINFONI epochs and observations produced by NIFS.
Current usage metrics show cumulative count of Article Views (full-text article views including HTML views, PDF and ePub downloads, according to the available data) and Abstracts Views on Vision4Press platform.
Data correspond to usage on the plateform after 2015. The current usage metrics is available 48-96 hours after online publication and is updated daily on week days.
Initial download of the metrics may take a while.