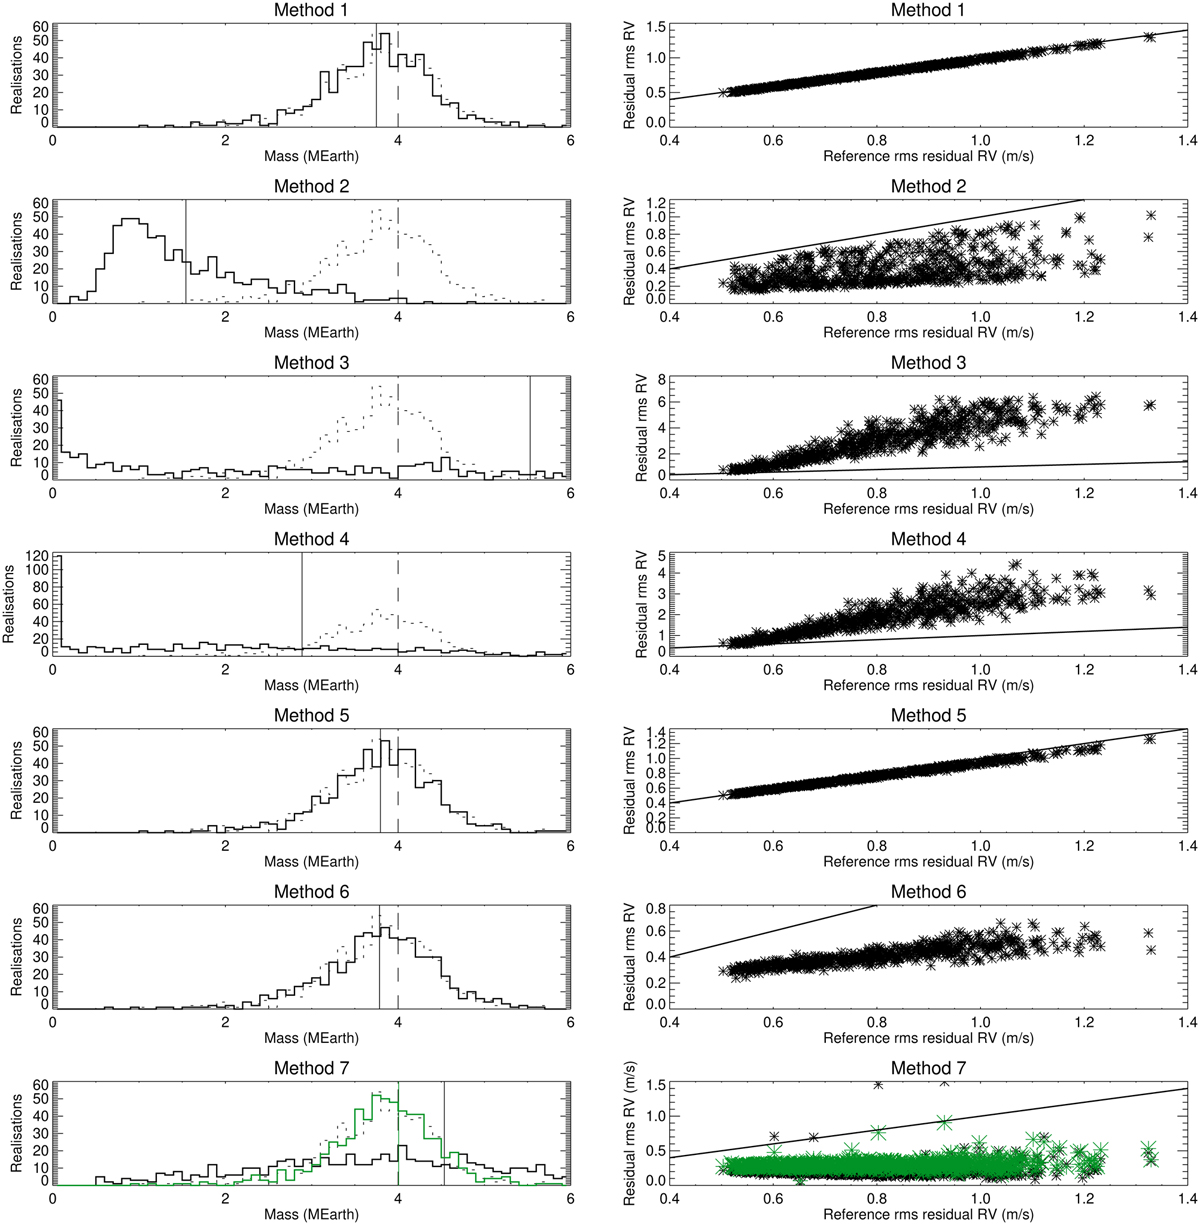
Fig. 7

Download original image
Distribution of the fitted masses (left panel) and rms of the residuals vs. the reference rms (right panels) for a selection of methods (numbers in Table B.1). This corresponds to the follow-up realisations for G2 stars, a planet mass of 4 MEarth, the middle of the habitable zone, and a lower spot contrast. The distributions show the reference mass distribution from Sect. 3 (dotted line) and the tested methods (solid lines). For the GP method (7), the results for the analysis performed on the original series are shown as solid black lines, while those corresponding to the analysis performed on the residuals from Sect. 3.2 are shown in green. The vertical solid lines in the left panels correspond to the average mass estimate for the corresponding distribution.
Current usage metrics show cumulative count of Article Views (full-text article views including HTML views, PDF and ePub downloads, according to the available data) and Abstracts Views on Vision4Press platform.
Data correspond to usage on the plateform after 2015. The current usage metrics is available 48-96 hours after online publication and is updated daily on week days.
Initial download of the metrics may take a while.


