Fig. 6

Download original image
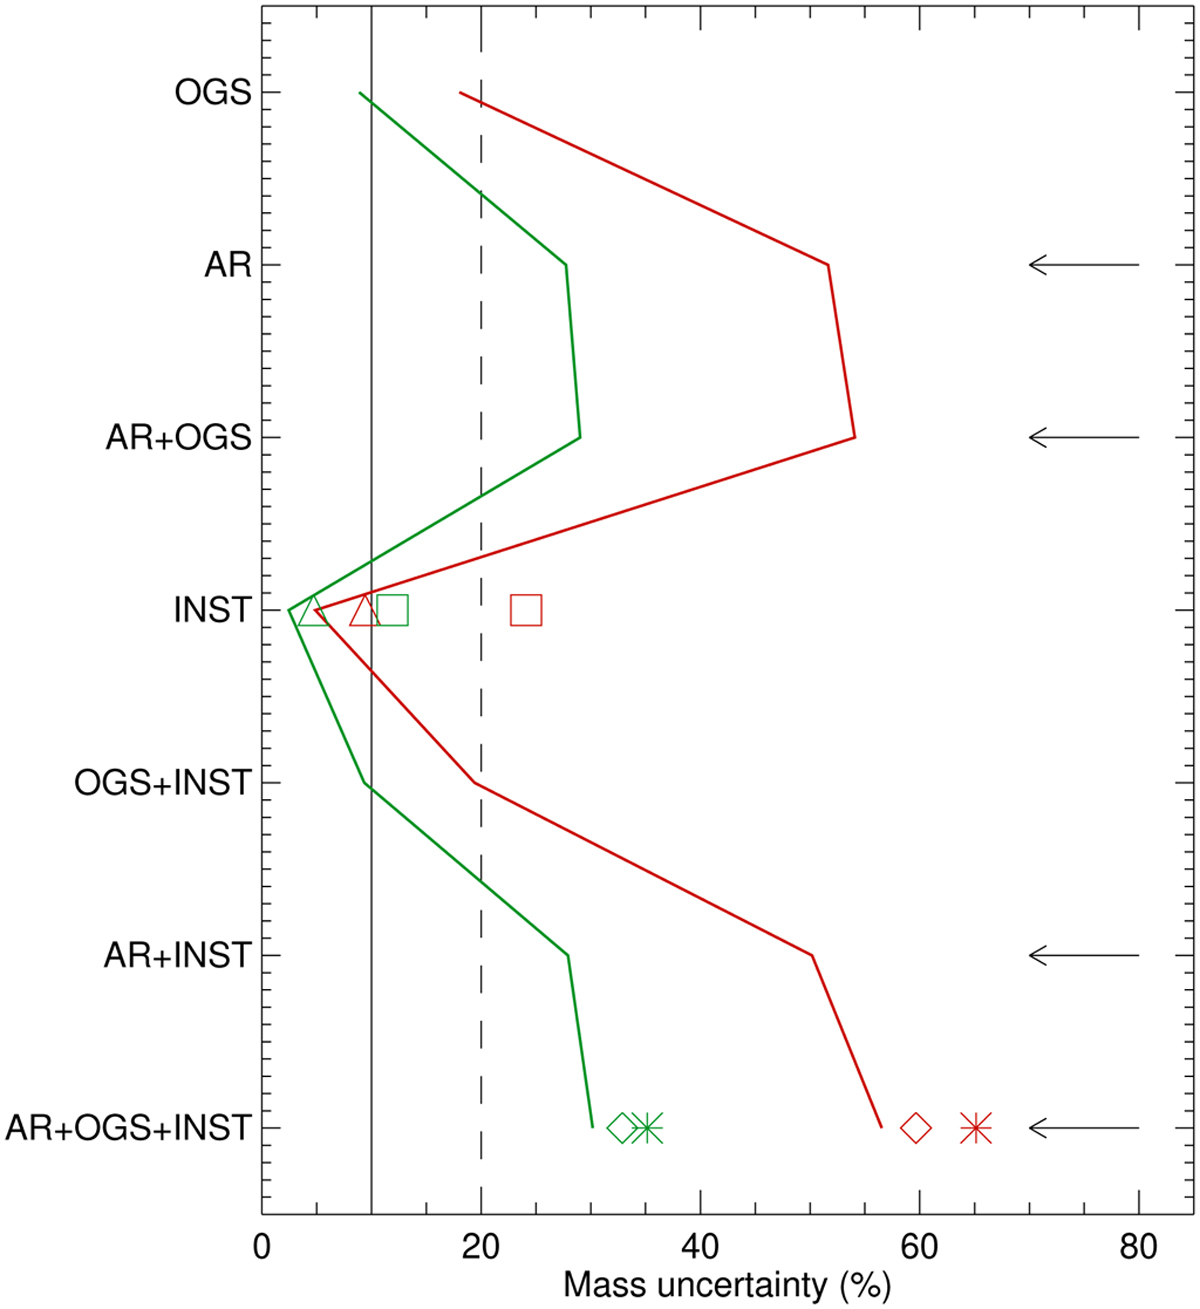
Mass uncertainty in the follow-up blind tests vs. configuration (see Table 3 for details) for ΔTspot1, 1 MEarth (red), and 2 MEarth (green) for the WGN of 0.09 m s−1, G2 stars, and for PHZmid. Arrows highlight configurations that include the AR contribution. Other symbols correspond to other specific configurations: a higher level of supergranulation (stars), a six-month gap instead of a four-month gap (diamonds), a noise level of 0.17 m s−1 (triangles), and a noise level of 0.45 m s−1 (squares), with the same colour code for the mass (three identical symbols are used for all PHZ values to simplify the representation).
Current usage metrics show cumulative count of Article Views (full-text article views including HTML views, PDF and ePub downloads, according to the available data) and Abstracts Views on Vision4Press platform.
Data correspond to usage on the plateform after 2015. The current usage metrics is available 48-96 hours after online publication and is updated daily on week days.
Initial download of the metrics may take a while.


