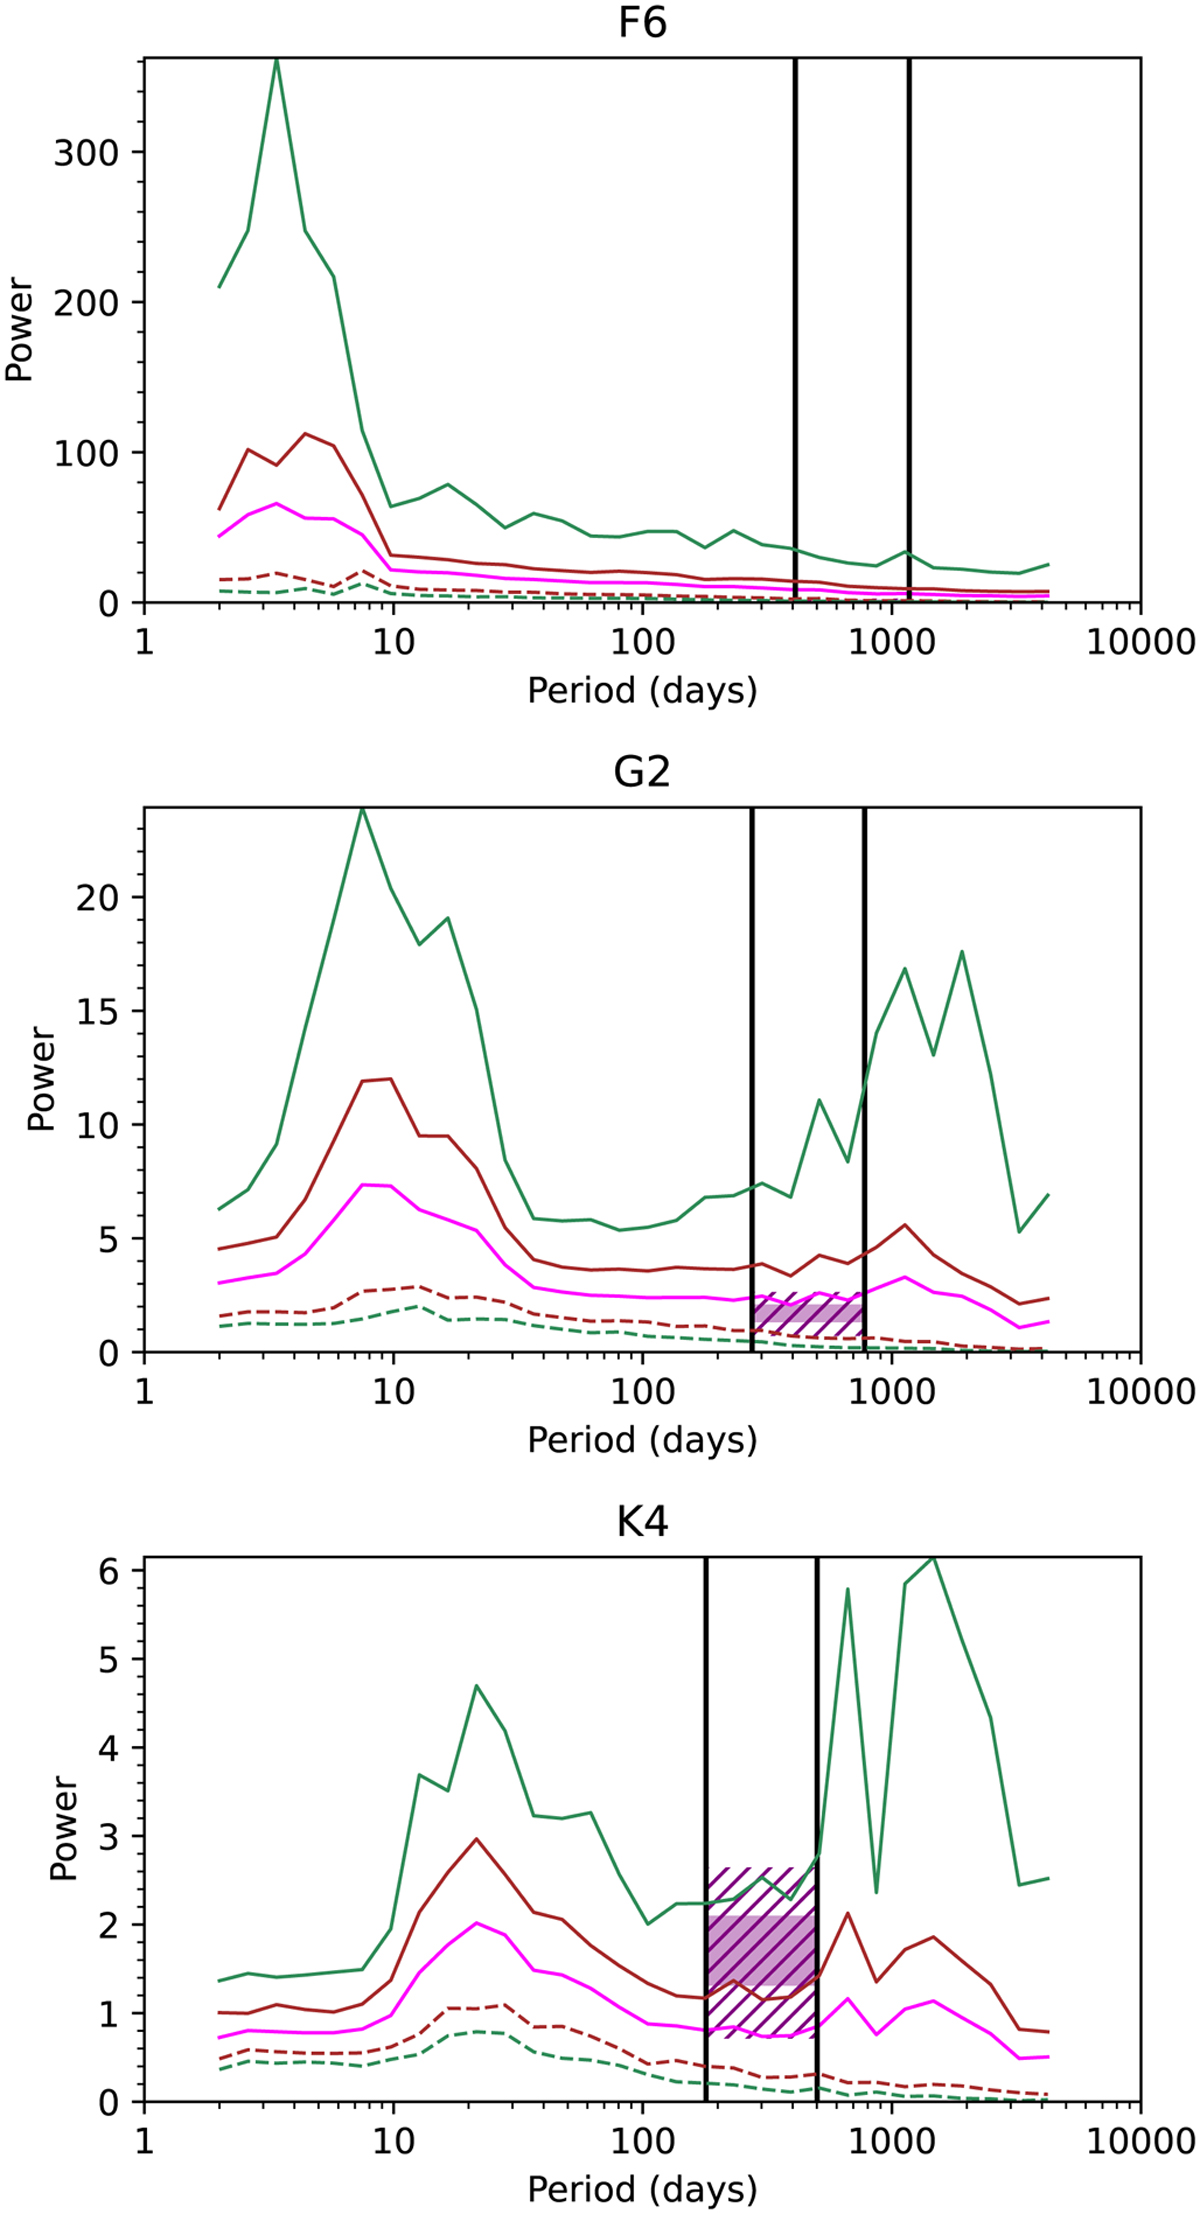
Fig. 14

Download original image
Envelope of the different LSP realisations after correction at ±ìcr (brown) and ± 2σ (green). We show the upper envelope (solid line) and lower envelope (dashed line) for the F6, G2, and K4 spectral types (from top to bottom). The average power is plotted in pink. The typical power due to a 1 MEarth planet alone (without activity) in the habitable zone (delimited by the two vertical lines) is shown in purple. The filled rectangle corresponds to the ± 1σ levels, and the dashed lines indicate the full extent of possible values for the planet signal.
Current usage metrics show cumulative count of Article Views (full-text article views including HTML views, PDF and ePub downloads, according to the available data) and Abstracts Views on Vision4Press platform.
Data correspond to usage on the plateform after 2015. The current usage metrics is available 48-96 hours after online publication and is updated daily on week days.
Initial download of the metrics may take a while.


