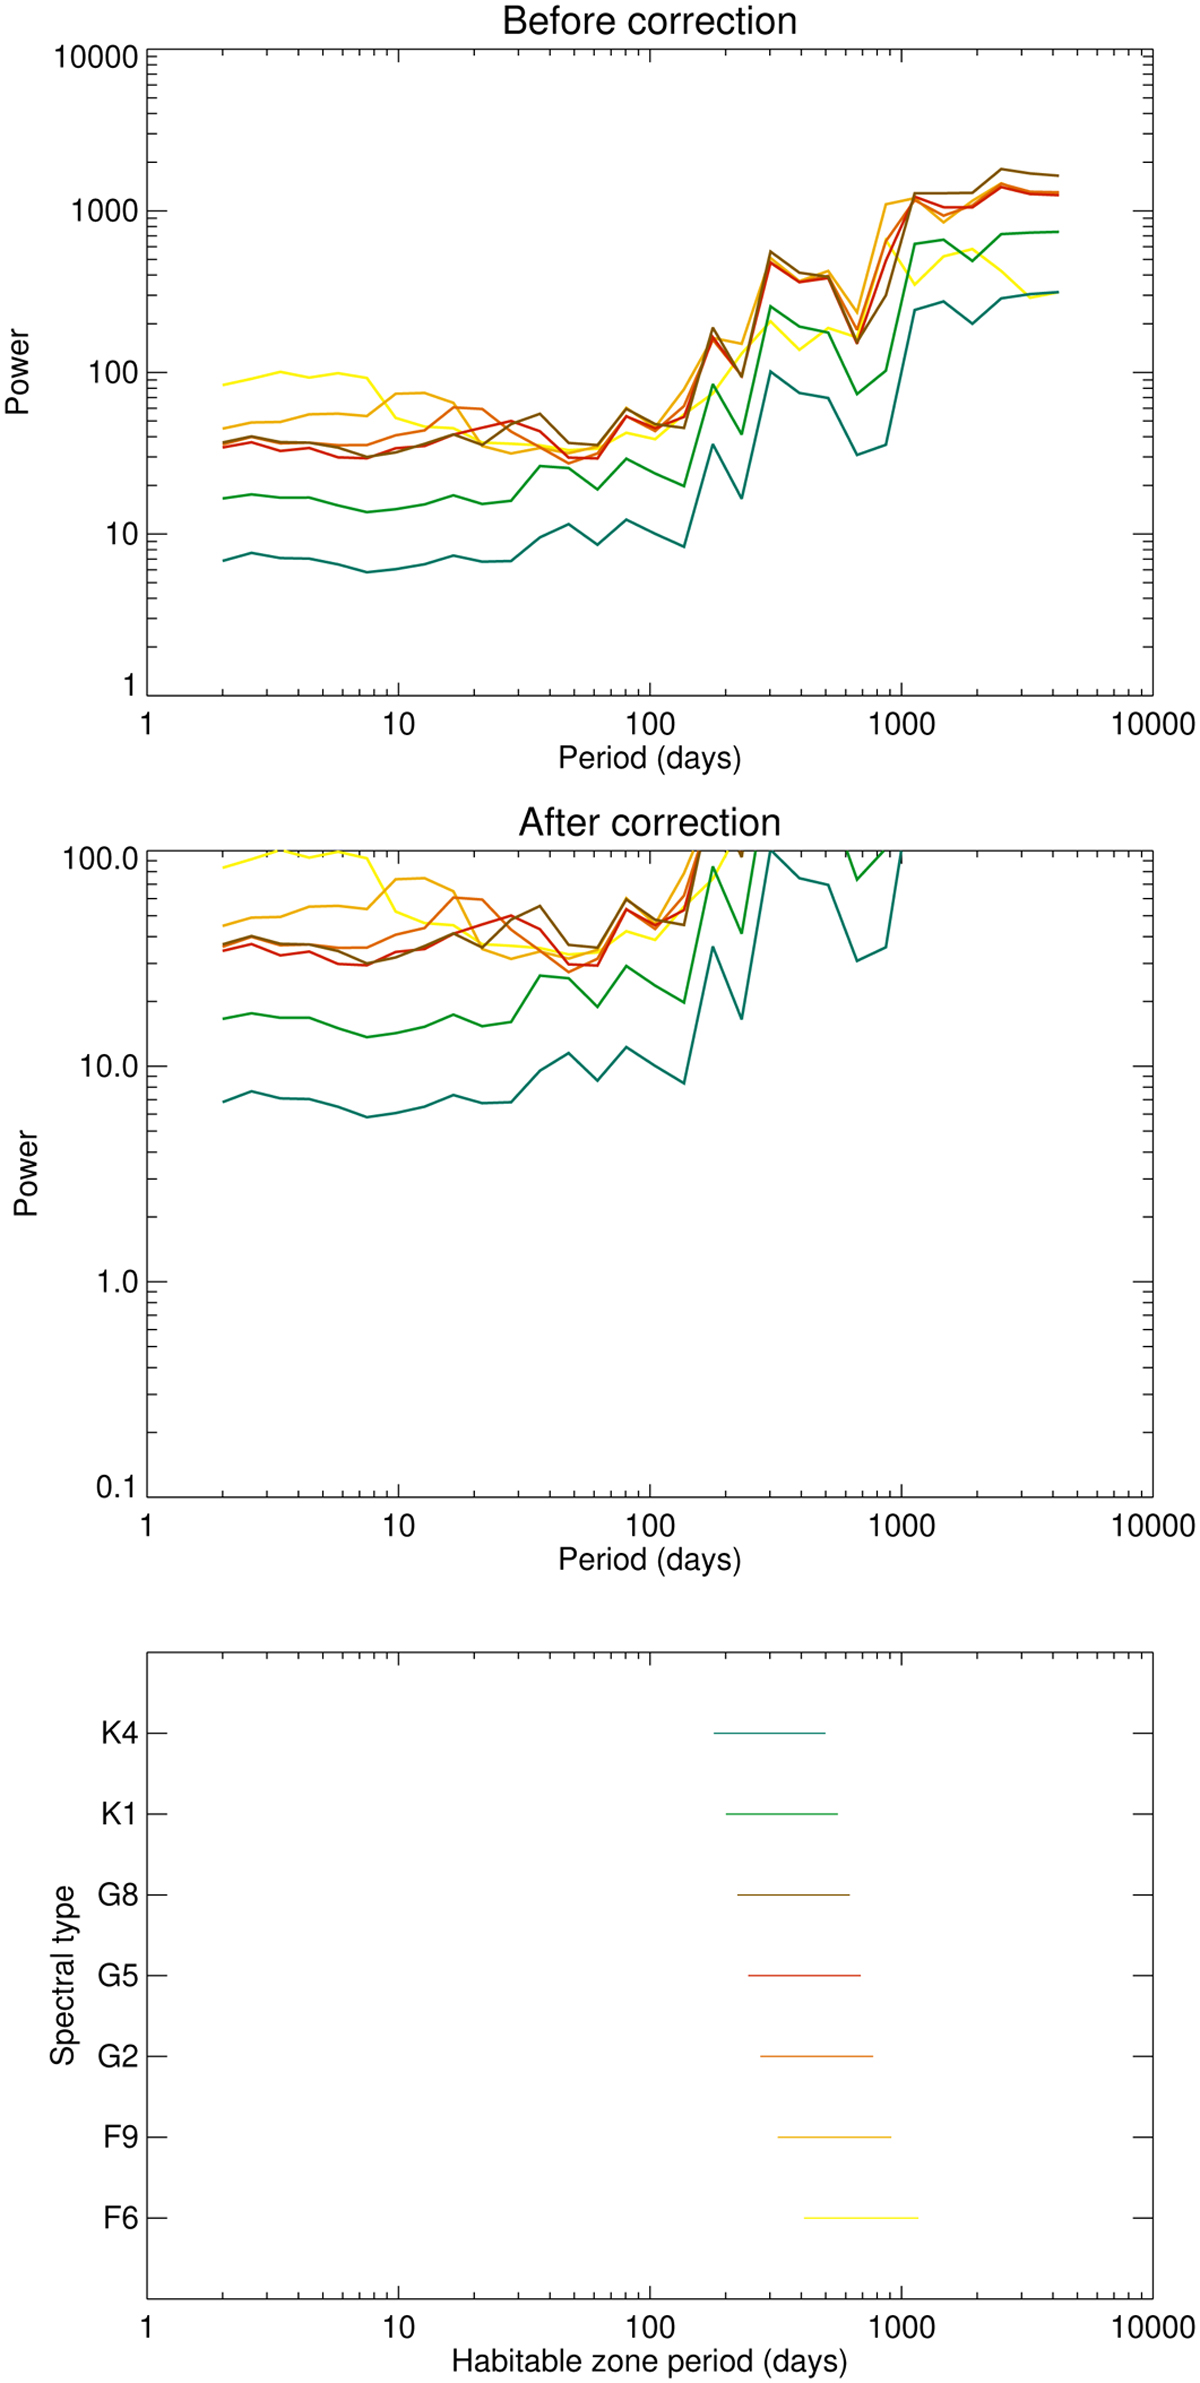
Fig. 13

Download original image
Maximum power in the LSP, averaged over the realisations, vs. period range for the seven spectral types before (upper panel) and after correction (middle panel). The residuals are from the follow-up analysis for ΔTspot1, the middle of the habitable zone, and 1 MEarth (fitted planetary signal removed). The habitable zone for each spectral type is shown in the lower panel, which also indicates the colour code for each of them (from top to bottom in this panel: K4 to F6).
Current usage metrics show cumulative count of Article Views (full-text article views including HTML views, PDF and ePub downloads, according to the available data) and Abstracts Views on Vision4Press platform.
Data correspond to usage on the plateform after 2015. The current usage metrics is available 48-96 hours after online publication and is updated daily on week days.
Initial download of the metrics may take a while.


