Fig. 12

Download original image
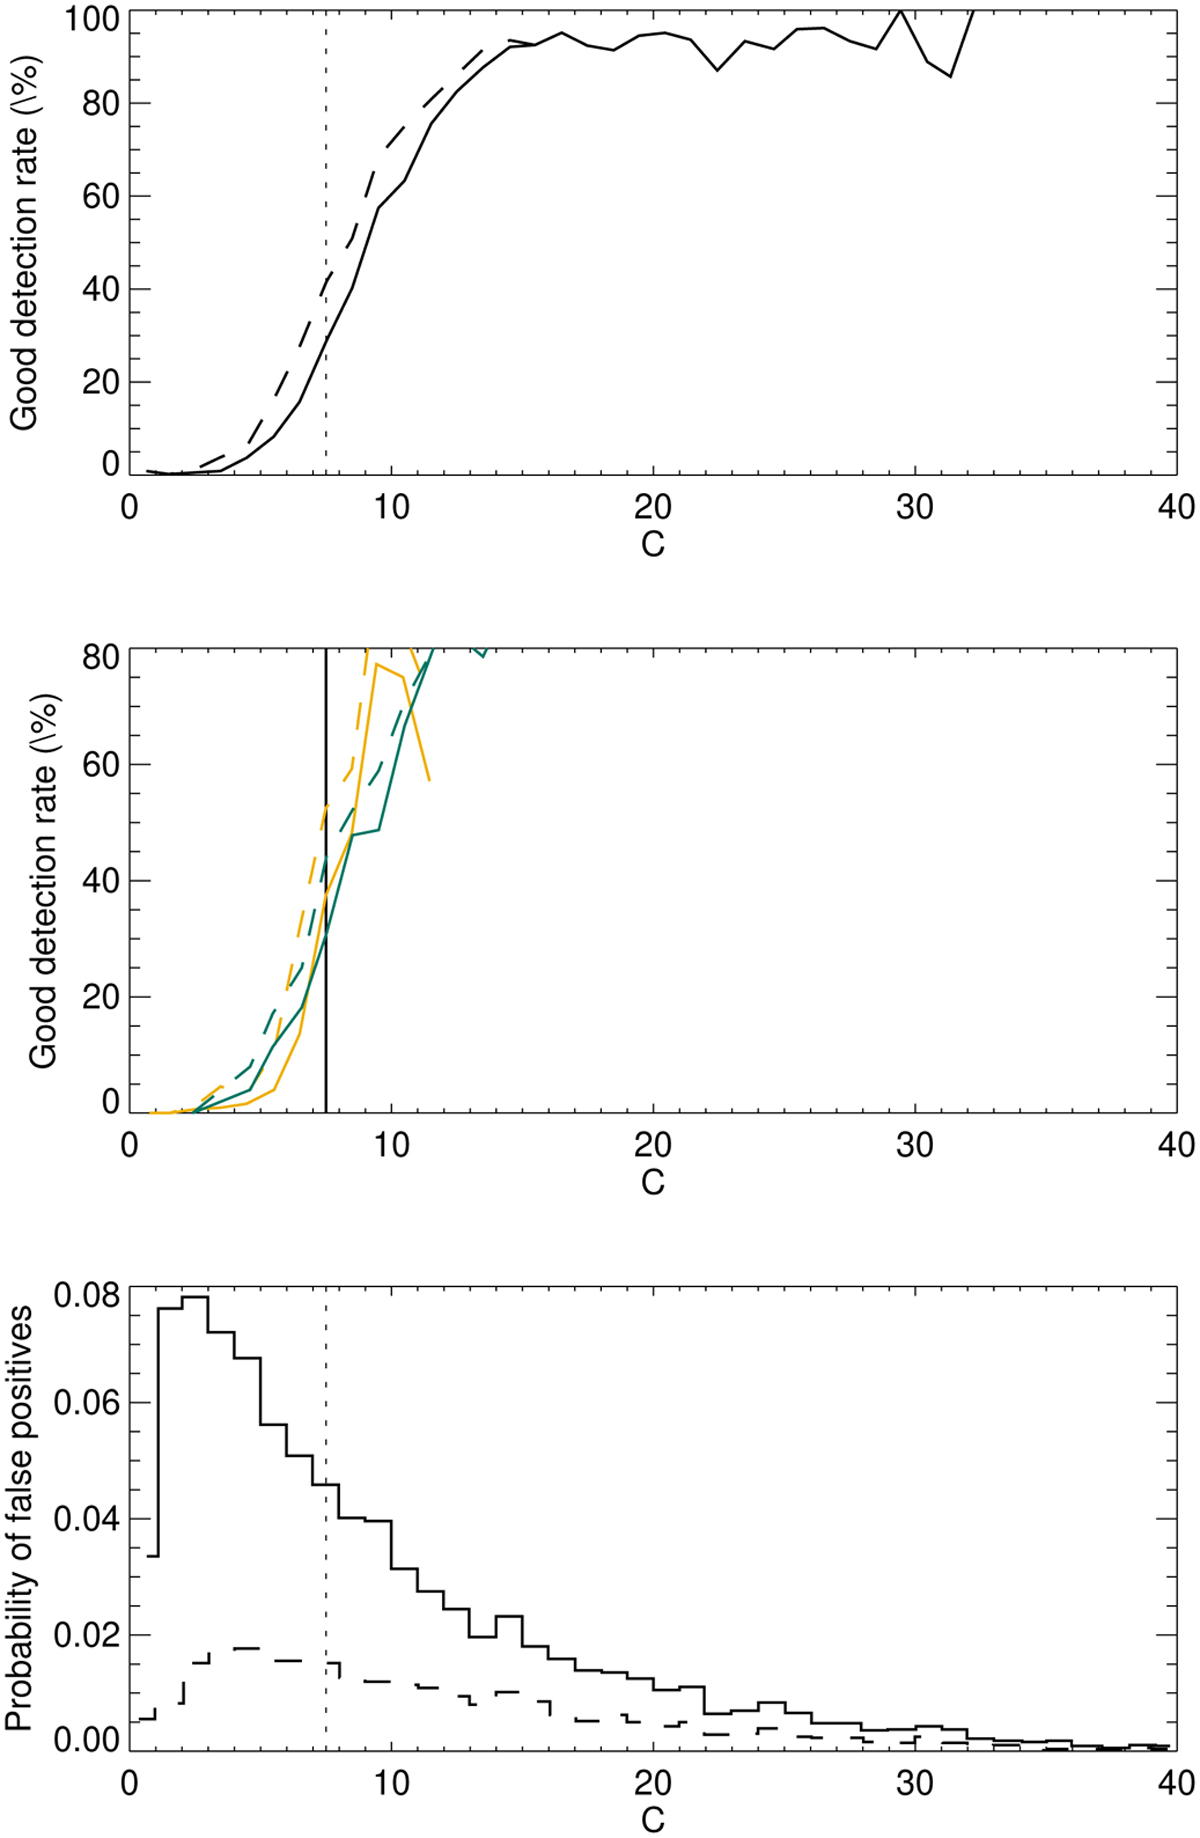
Good detection rates vs. criterion C defined in Dumusque et al. (2017), see Eq. (2) for a definition, for all planet masses and all spectral types (upper panel) for protocol A (solid line) and protocol B (dashed line). The vertical line indicates the 7.5 level from Dumusque et al. (2017). The middle panel shows the same curves for F9 stars (yellow) and K4 stars (blue). The lower panel shows the probability (computed as the number of false positives in that bin divided by the total number of false positives) of false positives vs. ![]() , a value of C estimated from the fitted mass for time series that have no planet (in contrast to the two upper panels) and that created a false positive, for protocol A (solid line) and protocol B (dashed line).
, a value of C estimated from the fitted mass for time series that have no planet (in contrast to the two upper panels) and that created a false positive, for protocol A (solid line) and protocol B (dashed line).
Current usage metrics show cumulative count of Article Views (full-text article views including HTML views, PDF and ePub downloads, according to the available data) and Abstracts Views on Vision4Press platform.
Data correspond to usage on the plateform after 2015. The current usage metrics is available 48-96 hours after online publication and is updated daily on week days.
Initial download of the metrics may take a while.


