Fig. 1

Download original image
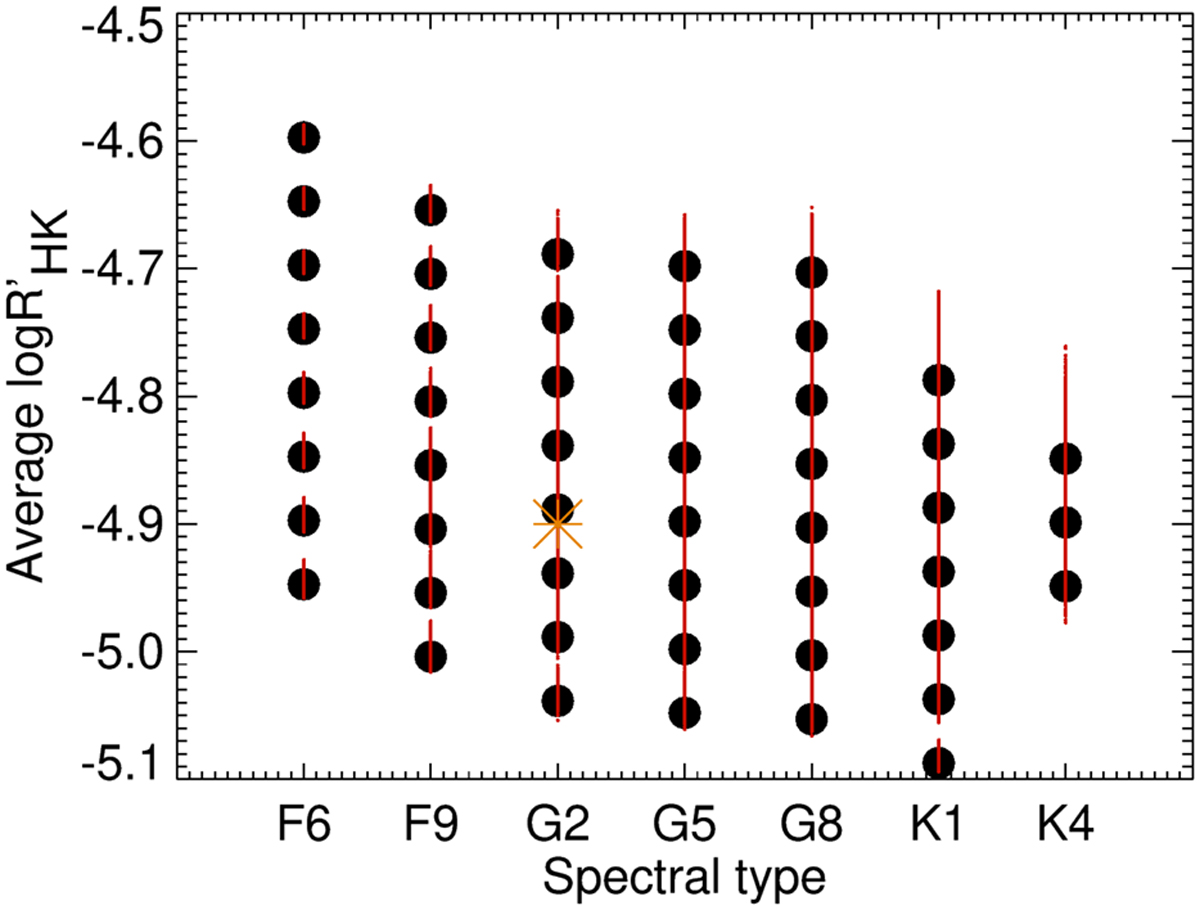
log ![]() vs. spectral type in our grid of simulations of the magnetic activity contribution (Paper I). Large filled circles correspond to the averaged targeted log
vs. spectral type in our grid of simulations of the magnetic activity contribution (Paper I). Large filled circles correspond to the averaged targeted log ![]() in the grid, and the actual average (over each time series) log
in the grid, and the actual average (over each time series) log ![]() in all simulations (the dispersion of the dots is due to each realisation and inclination) is represented in red. The lower envelope corresponds to the observed log
in all simulations (the dispersion of the dots is due to each realisation and inclination) is represented in red. The lower envelope corresponds to the observed log ![]() as a function of spectral type (e.g. Mittag et al. 2013; Boro Saikia et al. 2018), and the upper envelope was chosen in Paper I to correspond to the limit between stars that are mostly dominated by plages in photometry (like the Sun) and stars that are spot dominated following Radick et al. (2018). The average position of the Sun is shown as an orange star.
as a function of spectral type (e.g. Mittag et al. 2013; Boro Saikia et al. 2018), and the upper envelope was chosen in Paper I to correspond to the limit between stars that are mostly dominated by plages in photometry (like the Sun) and stars that are spot dominated following Radick et al. (2018). The average position of the Sun is shown as an orange star.
Current usage metrics show cumulative count of Article Views (full-text article views including HTML views, PDF and ePub downloads, according to the available data) and Abstracts Views on Vision4Press platform.
Data correspond to usage on the plateform after 2015. The current usage metrics is available 48-96 hours after online publication and is updated daily on week days.
Initial download of the metrics may take a while.


