Fig. 5.
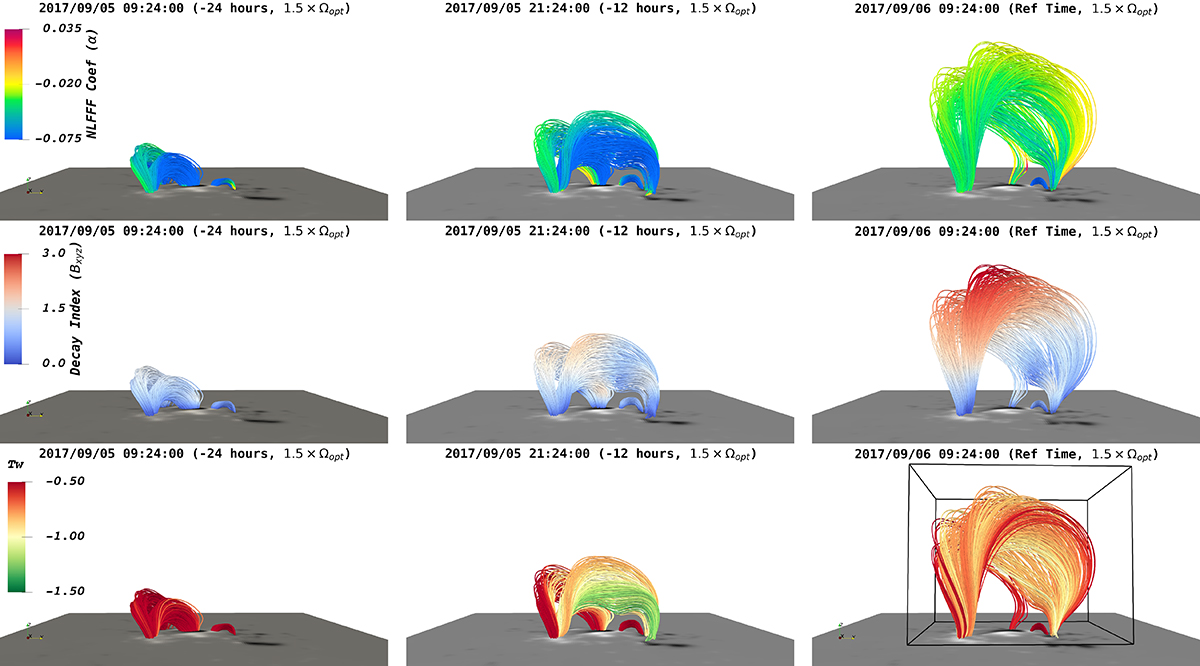
Download original image
Investigation of the flux rope eruption mechanisms. The top row shows the field lines colored based on the scaled NLFFF coefficient, the middle row the decay index and the bottom row the twist number (see the text for the explanation). The results are shown from left to right for initializing the zero-β MHD simulation with the TMFM snapshot at t−24, t−12, and tref. The bottom part of the figures shows the magnetogram, which is the bottom boundary of our simulations. The results are shown here only for the 1.5 × Ωopt. In the bottom right panel the subdomain enclosing the main flux system is indicated by the black box.
Current usage metrics show cumulative count of Article Views (full-text article views including HTML views, PDF and ePub downloads, according to the available data) and Abstracts Views on Vision4Press platform.
Data correspond to usage on the plateform after 2015. The current usage metrics is available 48-96 hours after online publication and is updated daily on week days.
Initial download of the metrics may take a while.