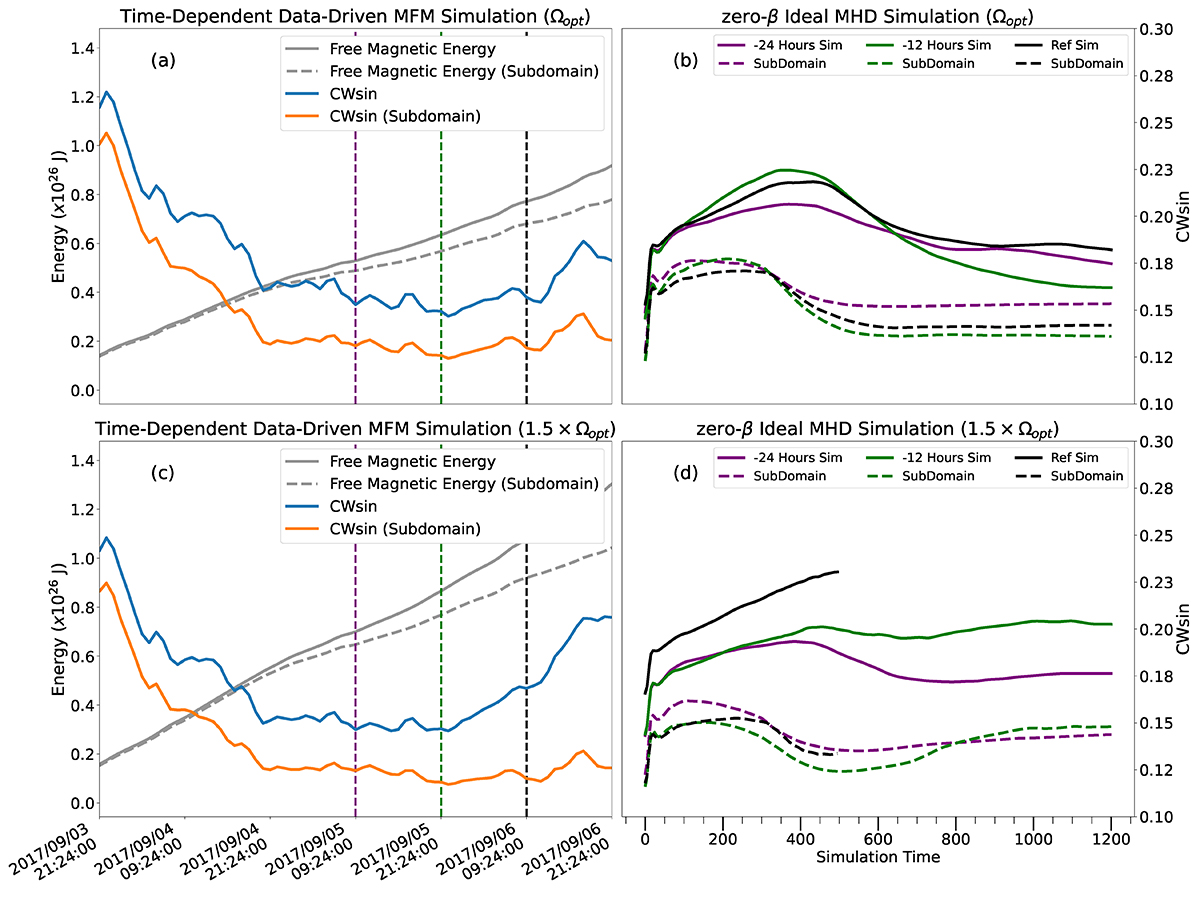
Fig. 4.
Download original image
Comparison of force-freeness and free magnetic energy in the TMFM and zero-β MHD simulations. Left panels: evolution of CWsin force-freeness factor during TMFM simulation of the entire computational box (blue) and a box enclosing the main flux rope (orange). The black curves show the evolution of free magnetic energy for the whole domain (solid curve) and the subdomain (dashed curve). The reference time (black), and times 12 (green) and 24 (purple) h before the reference time are shown by dashed vertical lines. Right panels: time evolution of CWsin in the zero-β MHD simulation for the whole domain (solid) and subdomain (dashed). The top panels show the results for the optimized Ω and the bottom panels for the 1.5 × optimized Ω.
Current usage metrics show cumulative count of Article Views (full-text article views including HTML views, PDF and ePub downloads, according to the available data) and Abstracts Views on Vision4Press platform.
Data correspond to usage on the plateform after 2015. The current usage metrics is available 48-96 hours after online publication and is updated daily on week days.
Initial download of the metrics may take a while.