Fig. 3.
Download original image
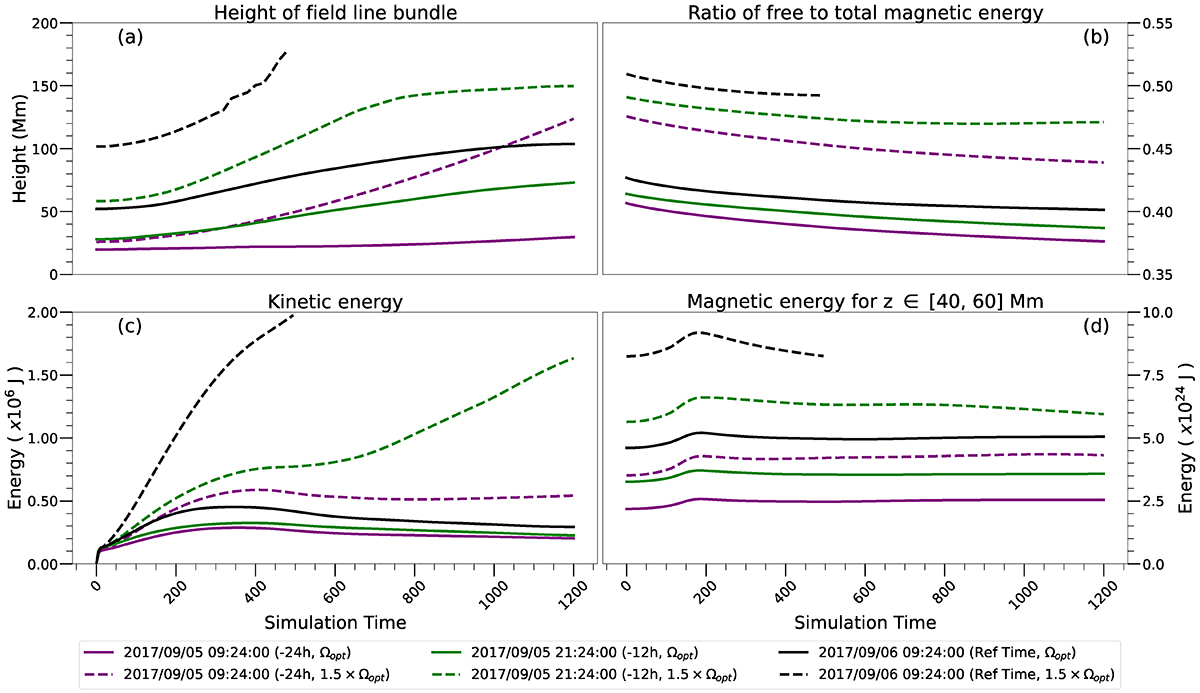
Parametric evolution of the zero-β MHD simulation. The panels show: a) the apex altitude of the main flux rope, b) the ratio of the free to total magnetic energy, c) kinetic energy, and d) the slab magnetic energy as a function of simulation time (in seconds) in the zero-β MHD simulation. The black curve shows the run where the MHD simulation was initialized with the TMFM snapshot at the reference time, and the purple (green) curves the case where the simulations were initialized 24 (12) h before the reference time. The solid curves show the results for the optimized Ω and the dashed lines for the 1.5 × optimized Ω. The tracking is continued until the boundary effects start to take over when the flux rope approaches the top of the simulation box (case for the reference time run with 1.5 × Ωopt), see the text for details.
Current usage metrics show cumulative count of Article Views (full-text article views including HTML views, PDF and ePub downloads, according to the available data) and Abstracts Views on Vision4Press platform.
Data correspond to usage on the plateform after 2015. The current usage metrics is available 48-96 hours after online publication and is updated daily on week days.
Initial download of the metrics may take a while.