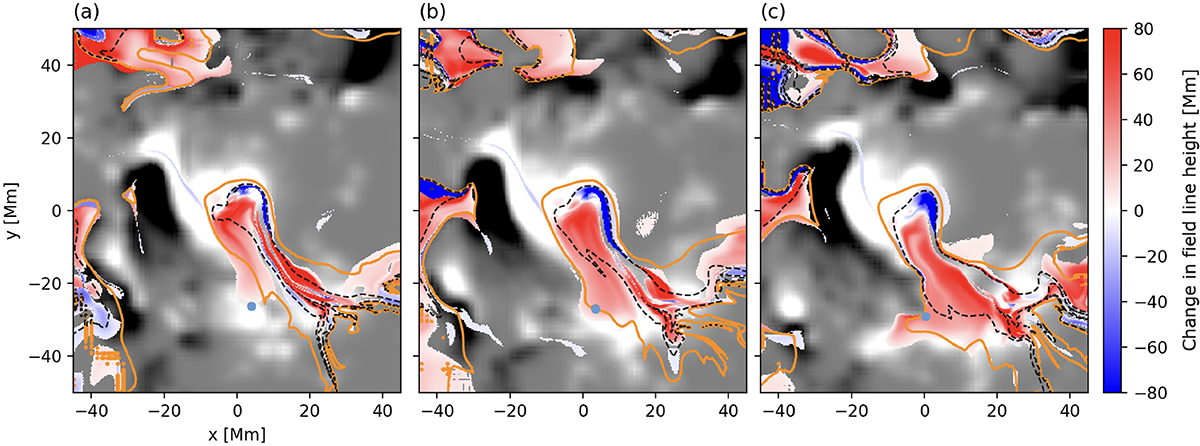
Fig. 2.
Download original image
Change of the maximum height of field lines rooted in the photosphere at time t = 600 s compared to their initial height, Δh = h(t = 600)−h(t = 0). Panels from left to right show the result for the simulations initialized at t−24, t−12 and the reference time, respectively, using Ωopt. The orange solid (black dashed) contour indicates field lines of lengths 100 (200) Mm. The gray scale shows the vertical component of photospheric magnetic field saturated at ±0.1 T.
Current usage metrics show cumulative count of Article Views (full-text article views including HTML views, PDF and ePub downloads, according to the available data) and Abstracts Views on Vision4Press platform.
Data correspond to usage on the plateform after 2015. The current usage metrics is available 48-96 hours after online publication and is updated daily on week days.
Initial download of the metrics may take a while.