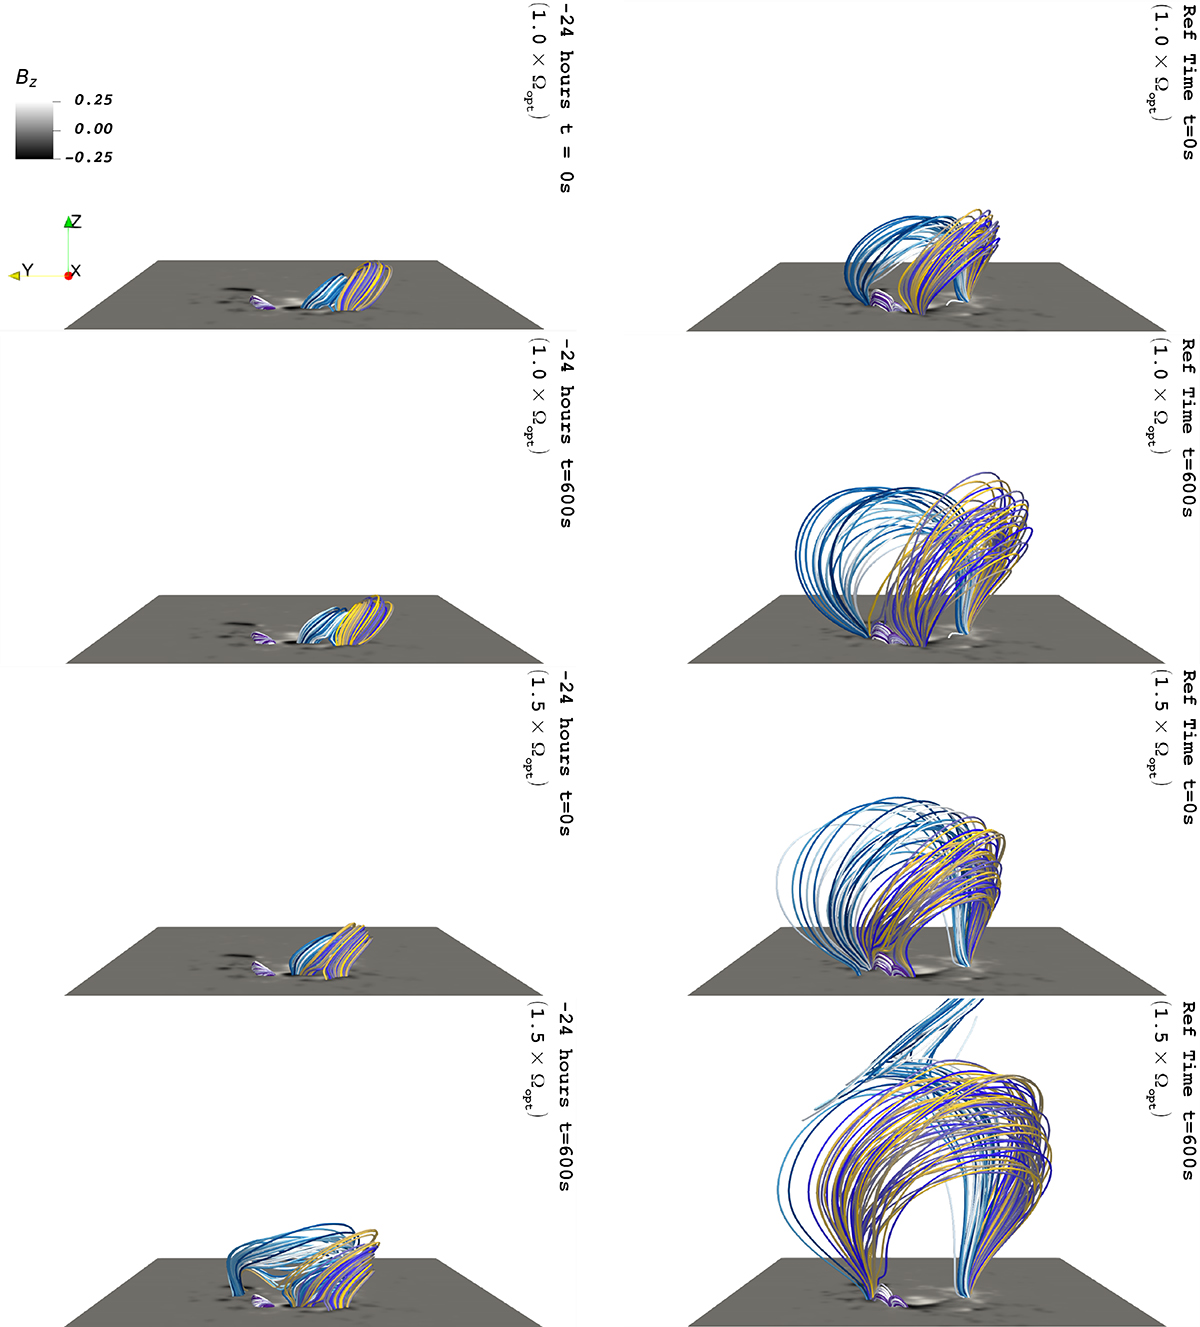
Fig. 1.
Download original image
Snapshots of the zero-β MHD simulation showing the evolution of the multiflux system preceding the September 6, 2017 flare and its accompanying CME eruption. The top and third rows show the initial situation for the simulations (t = 0) and the second and bottom rows the simulations at time t = 600 s. The left panels give results when the zero-β MHD simulation was initialized with the TMFM snapshot at time t−24, i.e., 24 h before the reference time, while the right panels show the results when the initialization was made at the reference time (September 6, 2017 at 09:24 UT). The two top panels give the results when the TMFM simulation was performed with the optimized Ω and the bottom rows when it was performed with 1.5 times the optimized Ω. The color of the field lines were selected in order to facilitate the visual distinguishability of the flux systems.
Current usage metrics show cumulative count of Article Views (full-text article views including HTML views, PDF and ePub downloads, according to the available data) and Abstracts Views on Vision4Press platform.
Data correspond to usage on the plateform after 2015. The current usage metrics is available 48-96 hours after online publication and is updated daily on week days.
Initial download of the metrics may take a while.