Fig. 9
Download original image
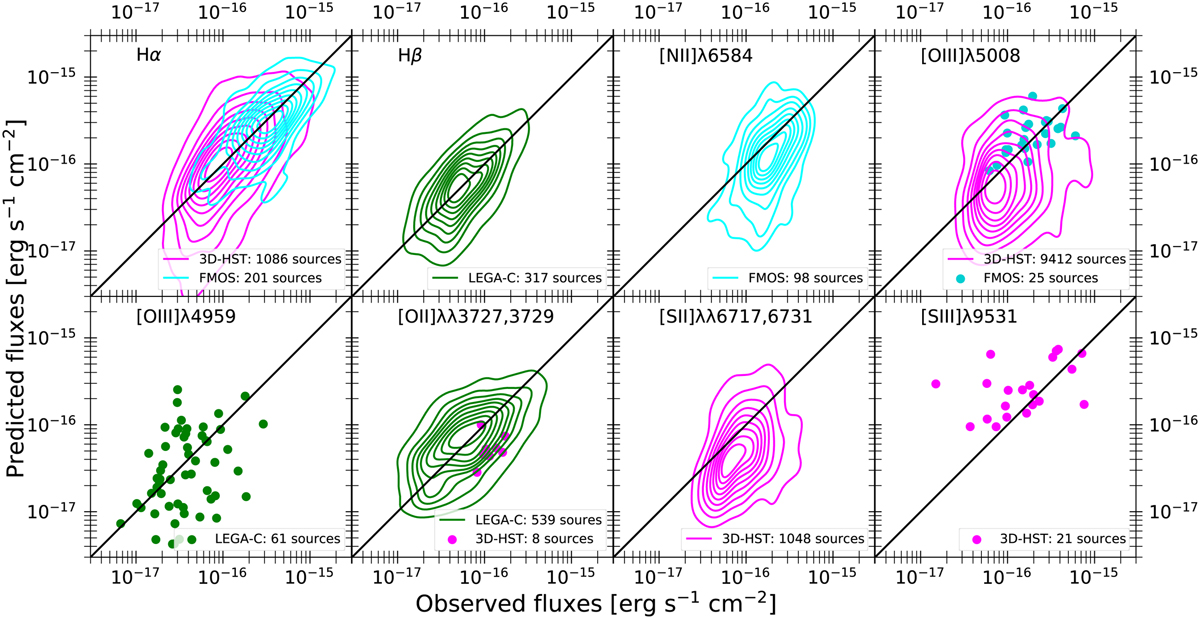
Comparison of the predicted fluxes to the observed fluxes coming from publicly released data of the near-infrared spectroscopic surveys 3D-HST (purple), FMOS (green) and LEGA-C (cyan). The contours correspond to iso-proportions of the distribution density starting at 20% with a 10% step. The scatter plots are indicated for the smallest samples. For our comparison we selected emission line measurements observed with S/N ≥ 3.5.
Current usage metrics show cumulative count of Article Views (full-text article views including HTML views, PDF and ePub downloads, according to the available data) and Abstracts Views on Vision4Press platform.
Data correspond to usage on the plateform after 2015. The current usage metrics is available 48-96 hours after online publication and is updated daily on week days.
Initial download of the metrics may take a while.