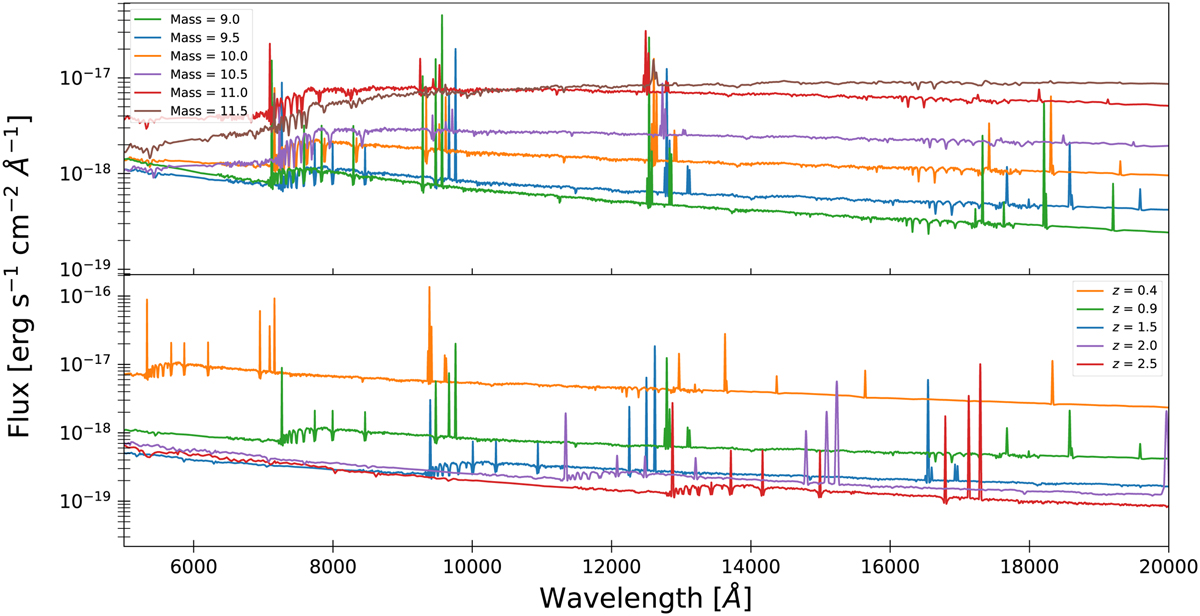
Fig. 8
Download original image
Examples of incident spectra constructed using SED fitting parameters from the L16 catalogue and empirical and theoretical relations for the emission lines. Top: spectra of galaxies with different stellar mass, indicated on the figure in log10(M* [M⊙]), and at z = 0.9. Bottom: spectra of galaxies at different redshift and with stellar mass equal to 9.5 in log10(M* [M⊙]).
Current usage metrics show cumulative count of Article Views (full-text article views including HTML views, PDF and ePub downloads, according to the available data) and Abstracts Views on Vision4Press platform.
Data correspond to usage on the plateform after 2015. The current usage metrics is available 48-96 hours after online publication and is updated daily on week days.
Initial download of the metrics may take a while.