Fig. 6
Download original image
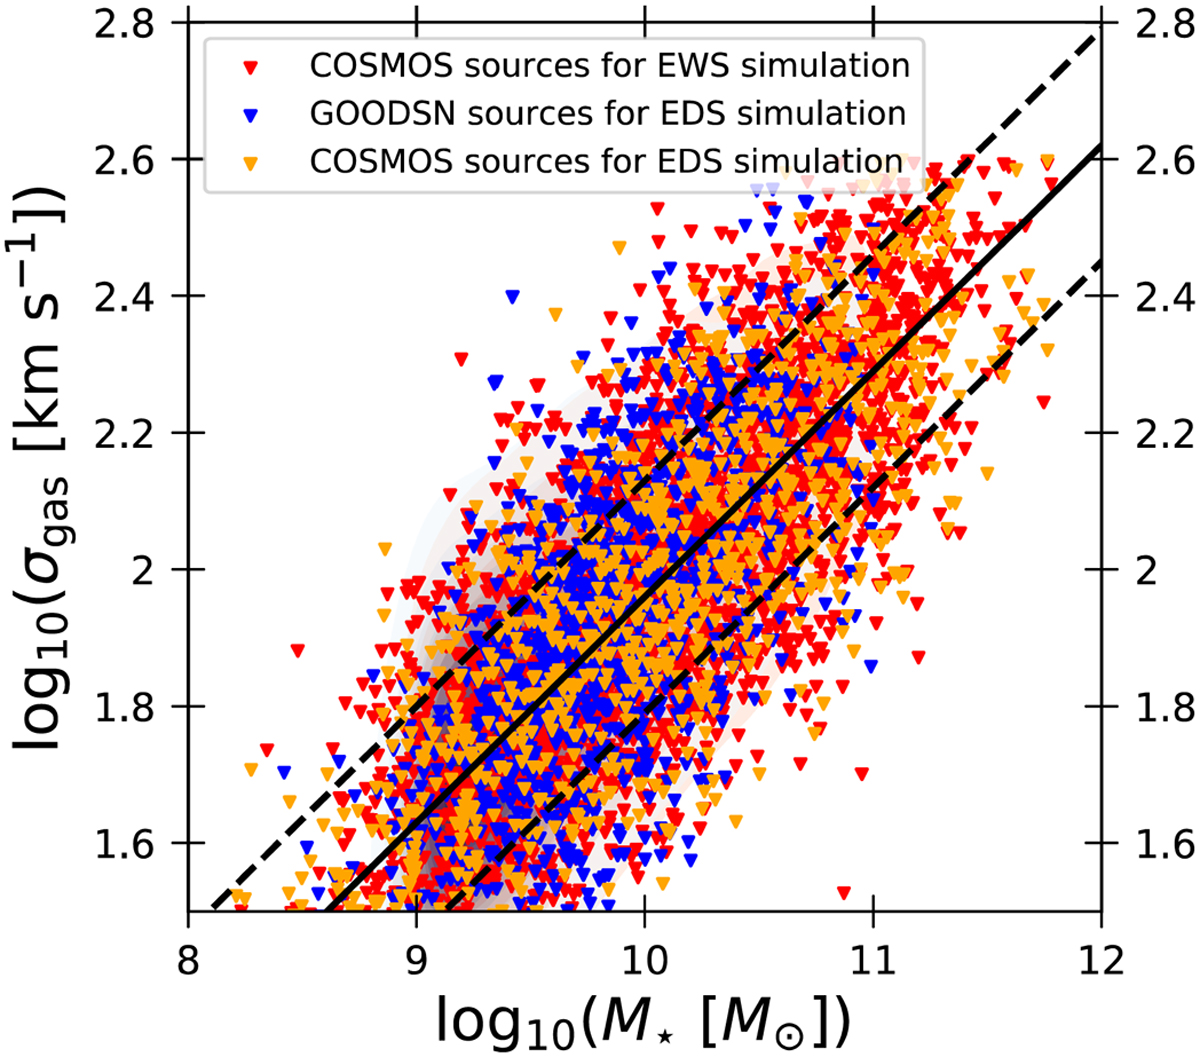
Predicted velocity dispersion in km s−1 as a function of the total stellar mass using the relation from Bezanson et al. (2018), indicated with the solid black line. The dashed black lines indicate the 0.17 dex scatter that we applied as explained in the text. Readers can refer to the caption of Fig. 1 for a colour assignment description.
Current usage metrics show cumulative count of Article Views (full-text article views including HTML views, PDF and ePub downloads, according to the available data) and Abstracts Views on Vision4Press platform.
Data correspond to usage on the plateform after 2015. The current usage metrics is available 48-96 hours after online publication and is updated daily on week days.
Initial download of the metrics may take a while.